chart
Displays data sets in a chart or a group of charts.
The chart control is based on the plotly.js
graphs library.
Plotly is a graphing library that provides a vast number of visual
representations of datasets with all sorts of customization capabilities. Taipy
exposes the Plotly components through the chart control and heavily depends on
the underlying implementation.
Using the Python API for Plotly
You may be familiar with the
Plotly Open Source Graphing Library for Python or find a piece of
code written in Python that produces a Plotly chart close to your objective. In this
situation, consider using the figure property of the chart control: this property
lets you define your chart entirely in Python using Plotly's API.
Please read the section of the figure property for more information.
There are many types of data representation that one can choose from, listed in the
Chart types catalog section, and each of these utilize specific
sets of the chart control properties.
For more general information on how to use the Taipy GUI chart control, we may want to look at
these two sections that provide more generic information on the control and how to use it in
specific situations best:
Chart types catalog
Because there are so many different ways of representing data, we have sorted the chart types supported by Taipy by application category:
Basic charts
Statistical charts
Scientific charts
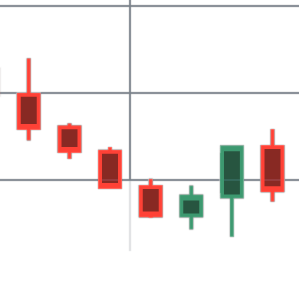
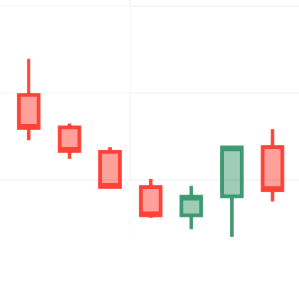
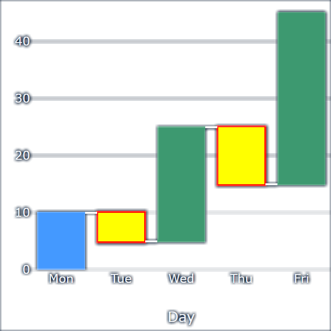
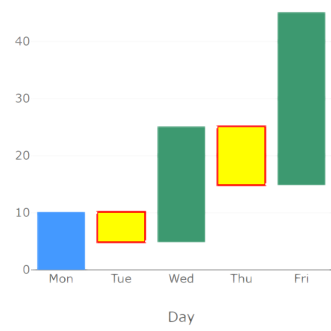
Financial charts
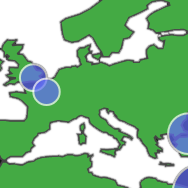
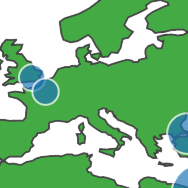
Maps
Specialized charts
Properties
| Name | Type | Default | Description |
|---|---|---|---|
|
anydynamic |
Required | The data object bound to this chart control. |
type |
strindexed |
scatter | Chart type. |
mode |
strindexed |
lines+markers | Chart mode. |
x |
strindexed |
Column name for the x axis. |
|
y |
strindexed |
Column name for the y axis. |
|
z |
strindexed |
Column name for the z axis. |
|
lon |
strindexed |
Column name for the longitude value, for 'scattergeo' charts. See Plotly Map traces. |
|
lat |
strindexed |
Column name for the latitude value, for 'scattergeo' charts. See Plotly Map traces. |
|
r |
strindexed |
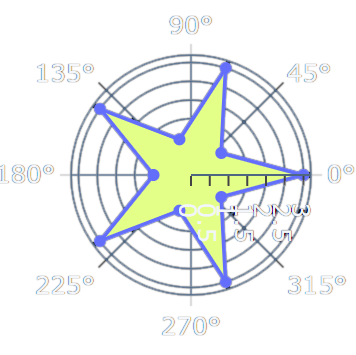
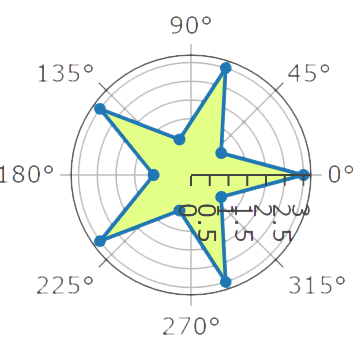
Column name for the r value, for 'scatterpolar' charts. See Plotly Polar charts. |
|
theta |
strindexed |
Column name for the theta value, for 'scatterpolar' charts. See Plotly Polar charts. |
|
high |
strindexed |
Column name for the high value, for 'candlestick' charts. See Plotly Candlestick charts. |
|
low |
strindexed |
Column name for the low value, for 'candlestick' charts. See Ploty Candlestick charts. |
|
open |
strindexed |
Column name for the open value, for 'candlestick' charts. See Plotly Candlestick charts. |
|
close |
strindexed |
Column name for the close value, for 'candlestick' charts. See Plotly Candlestick charts. |
|
measure |
strindexed |
Column name for the measure value, for 'waterfall' charts. See Plotly Waterfall charts. |
|
locations |
strindexed |
Column name for the locations value. See Plotly Choropleth maps. |
|
values |
strindexed |
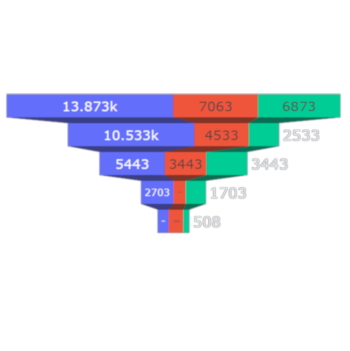
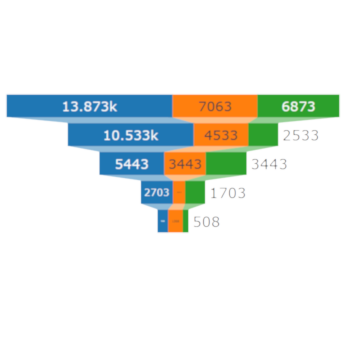
Column name for the values value. See Plotly Pie charts or Plotly Funnel Area charts. |
|
labels |
strindexed |
Column name for the labels value. See Plotly Pie charts. |
|
parents |
strindexed |
Column name for the parents value. See Plotly Treemap charts. |
|
text |
strindexed |
Column name for the text associated to the point for the indicated trace. |
|
base |
strindexed |
Column name for the base value. Used in bar charts only. |
|
title |
str |
The title of this chart control. |
|
render |
booldynamic |
True | If True, this chart is visible on the page. |
on_range_change |
Callback |
The callback function that is invoked when the visible part of the x axis changes. |
|
columns |
str|list[str]|dict[str, dict[str, str]] |
All columns | The list of column names
|
label |
strindexed |
The label for the indicated trace. |
|
name |
strindexed |
The name of the indicated trace. |
|
selected |
dynamic(list[int]|strindexed |
The list of the selected point indices . |
|
color |
strindexed |
The color of the indicated trace (or a column name for scattered). |
|
selected_color |
strindexed |
The color of the selected points for the indicated trace. |
|
marker |
dict[str, any]indexed |
The type of markers used for the indicated trace. |
|
line |
str|dict[str, any]indexed |
The configuration of the line used for the indicated trace. |
|
selected_marker |
dict[str, any]indexed |
The type of markers used for selected points in the indicated trace. |
|
layout |
dict[str, any]dynamic |
The plotly.js compatible layout object. |
|
plot_config |
dict[str, any] |
The plotly.js compatible configuration options object. |
|
options |
dict[str, any]indexed |
The plotly.js compatible data object where dynamic data will be overridden.. |
|
orientation |
strindexed |
The orientation of the indicated trace. |
|
text_anchor |
strindexed |
Position of the text relative to the point. |
|
xaxis |
strindexed |
The x axis identifier for the indicated trace. |
|
yaxis |
strindexed |
The y axis identifier for the indicated trace. |
|
width |
str|int|float |
"100%" | The width, in CSS units, of this element. |
height |
str|int|float |
The height, in CSS units, of this element. |
|
template |
dict |
The Plotly layout template. |
|
template[dark] |
dict |
The Plotly layout template applied over the base template when theme is dark. |
|
template[light] |
dict |
The Plotly layout template applied over the base template when theme is not dark. |
|
decimator |
taipy.gui.data.Decimatorindexed |
A decimator instance for the indicated trace that will reduce the size of the data being sent back and forth. |
|
rebuild |
booldynamic |
False | Allows dynamic config refresh if set to True. |
figure |
plotly.graph_objects.Figuredynamic |
A figure as produced by plotly. |
|
on_change |
Callback |
The name of a function that is triggered when the value is updated.
|
|
propagate |
bool |
App config | Allows the control's main value to be automatically propagated. |
active |
booldynamic |
True | Indicates if this component is active. |
id |
str |
The identifier that will be assigned to the rendered HTML component. |
|
properties |
dict[str, any] |
Bound to a dictionary that contains additional properties for this element. |
|
class_name |
strdynamic |
The list of CSS class names that will be associated with the generated HTML Element. |
|
hover_text |
strdynamic |
The information that is displayed when the user hovers over this element. |
(★)data is the default property for this visual element.
Details
The chart control has a large set of properties to deal with the many types of charts it supports and the different kinds of customization that can be defined.
The data property
All the data sets represented in the chart control must be assigned to its data property.
The supported types for the data property are:
- A list of values:
Most chart types use two axes (x/y or theta/r). When receiving a data that is just a series of values, Taipy sets the first axis values to the value index ([0, 1, ...]) and the values of the second axis to the values of the collection. - A Pandas DataFrame:
Taipy charts can be defined by setting the appropriate axis property value to the DataFrame column name. - A dictionary:
The value is converted into a Pandas DataFrame where each key/value pair is converted to a column named key and the associated value. Note that this will work only when all the values of the dictionary keys are series that have the same length. - A list of lists of values:
If all the lists have the same length, Taipy creates a Pandas DataFrame with it.
If sizes differ, then a DataFrame is created for each list, with a single column called "<index>/0" where index is the index of the current list in the data array. Then an array is built using all those DataFrames and used as described below. - A Numpy series:
Taipy internally builds a Pandas DataFrame with the provided data. - A list of Pandas DataFrames:
This can be used when your chart must represent data sets of different sizes. In this case, you must set the axis property (x, y, r, etc.) value to a string with the format: "<index>/<column>" where index is the index of the DataFrame you want to refer to (starting at index 0) and column would be the column name of the referenced DataFrame. - A list of dictionaries
The data is converted to a list of Pandas DataFrames.
Indexed properties
Chart controls can hold several traces that may display different data sets.
To indicate properties for a given trace, you will use the indexed properties
(the ones whose type is indexed(type)). When setting the value of an indexed
property, you can specify which trace this property should apply to: you will
use the property_name[index] syntax, where the indices start at index 1, to
specify which trace is targeted for this property.
Indexed properties can have a default value (using the property_name syntax with
no index) which is overridden by any specified indexed property:
Here is an example where i_property is an indexed property:
# This value applies to all the traces of the chart control
general_value = <some_value>
# This value applies to only the second trace of the chart control
specific_value = <some_other_value>

page = "<|...|chart|...|i_property={general_value}|i_property[2]={specific_value}|...|>"
In the definition for page, you can see that the value general_value is set to the
property without the index operator ([]) syntax. That means it applies to all the traces
of the chart control.
specific_value, on the other hand, applies only to the second trace.
An indexed property can also be assigned an array, without the index operator syntax. Then each value of the array is set to the property at the appropriate index, in sequence:
values = [
    value1,
    value2,
    value3
]

page = "<|...|chart|...|i_property={values}|...|>"
is equivalent to
page = "<|...|chart|...|i_property[1]={value1}|i_property[2]={value2}|i_property[3]={value3}|...|>"
or slightly shorter (and if there are no more than three traces):
page = "<|...|chart|...|i_property={value1}|i_property[2]={value2}|i_property[3]={value3}|...|>"
The figure property
As mentioned above, the chart control is implemented using the
plotly.js front-end library, and hides part of its complexity
using the control's properties. However Plotly comes with the handy
Plotly for Python library that lets programmers define their charts
entirely in Python.
If you are familiar with the Plotly Python API or if you have found, among the plethora of
examples available on the Internet, a piece of code that produce something close to your
expectations, you may feel like it can be tricky to mimic that the 'Taipy GUI way', using the chart
control and its properties.
However you can easily reuse your Python code using the figure property: this can be
set to an instance of plotly.graph_objects.Figure, which is the class used by Plotly Python to
handle the entire definition of a graph. When the chart is rendered on the page, it displays
exactly what was defined using the Plotly Python API.
Please check the Plotly Python example for more details.
Large datasets
Displaying large datasets poses several challenges, both from a technical and user experience standpoint. These challenges can impact performance, usability, and the overall effectiveness of data presentation.
The most prominent issues are:
- Performance Issues
- Loading Time: Large datasets can significantly increase the display time of your application, leading to a poor user experience.
- Memory Usage: Keeping large amounts of data in memory can strain client devices, potentially leading to browser crashes or sluggish performance.
- Network Performance: Transmitting large datasets over the network can be slow and expensive in terms of bandwidth, especially for users on limited data plans or slow connections.
- User Experience Challenges
- Designing visualizations that scale well with the size of the data and remain informative and actionable can be challenging.
- Technical Limitations
Browsers have limitations on how much data they can efficiently process and display, which can restrict the amount of data that can be shown at one time.
The chart control provides different classes that can help deliver relevant representations of large
data sets by applying a technical method called data decimation.
Data decimation involves reducing the volume of data to be sent to the browser and displayed without
significantly losing the usefulness of the original data. The goal is to make visualization more
efficient while retaining the essential characteristics of the data.
The taipy.gui.data package defines implementations of
different decimation algorithms in classes that inherit the Decimator class.
To use these algorithms and manage the challenges posed by representing large datasets, you must
instantiate the decimator class that best matches the dataset you are dealing with and set the
instance to the decimator property of the chart control that represents the data.
The rebuild property
You can download the entire source code used in this section from the GitHub repository.Some of the chart control's properties may result in Taipy GUI having to entirely reconstruct the
graphical component running on the front-end (the user's browser). The chart control provides some
properties that are dynamic and allow for an instant page update. Changing the values of the
other properties is not immediately reflected on the page.
Setting the value of the rebuild property to True, however, will ensure that the
control is entirely rebuilt on the front-end and refreshed on the page. Using this property will
have an impact on the user experience since it involves a potentially extensive code generation.
Make sure, when you use the rebuild property, that the deployment environment can support the
performance hit gracefully for the end users.
Here is an example of how this property can be used.
Consider the code below:
from taipy.gui import Gui
import math

# x values: [-10..10]
x_range = range(-10, 11)
data = {
    "X": x_range,
    "Y": [x*x for x in x_range],
    "Y2": [math.cos(2 * math.pi * x / 10) / 360 for x in x_range]
}

types = [("bar", "Bar"), ("line", "Line")]
selected_type = types[0]

page = """
<|{data}|chart|type={selected_type[0]}|x=X|y=Y|>

<|{selected_type}|toggle|lov={types}|>
"""

Gui(page=page).run()
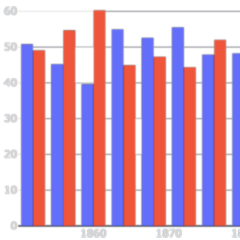
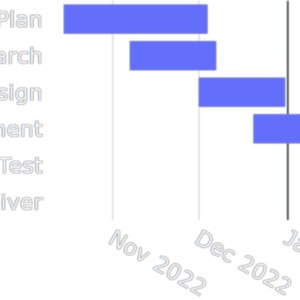
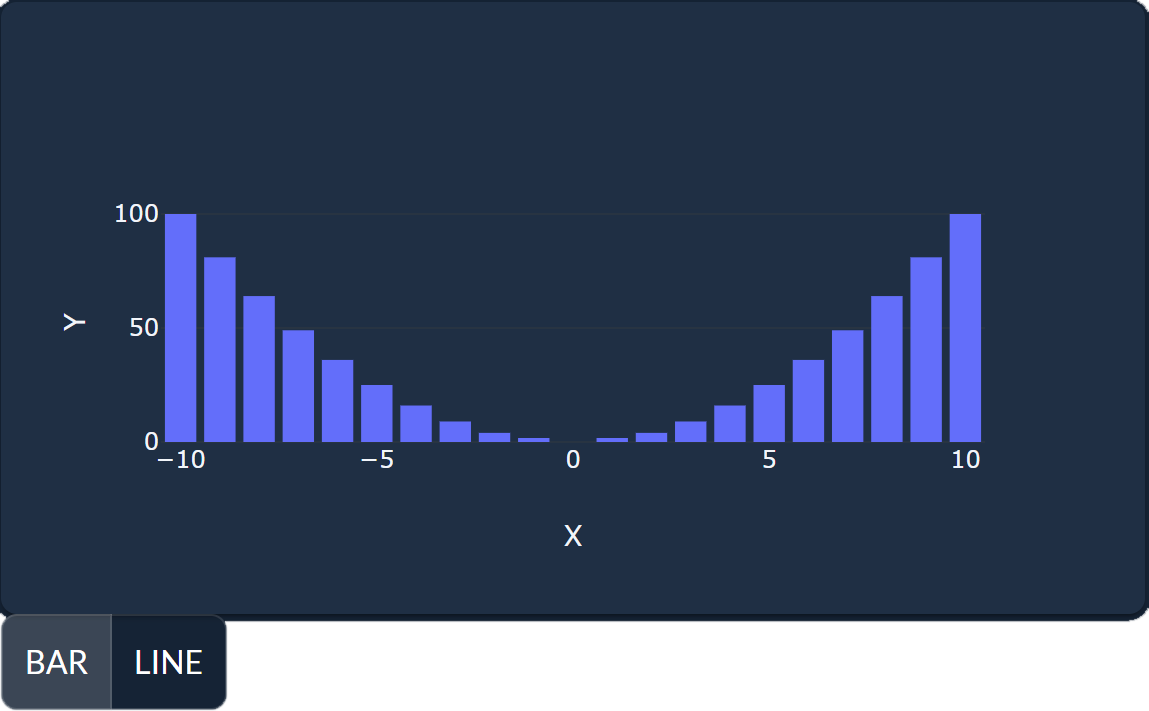
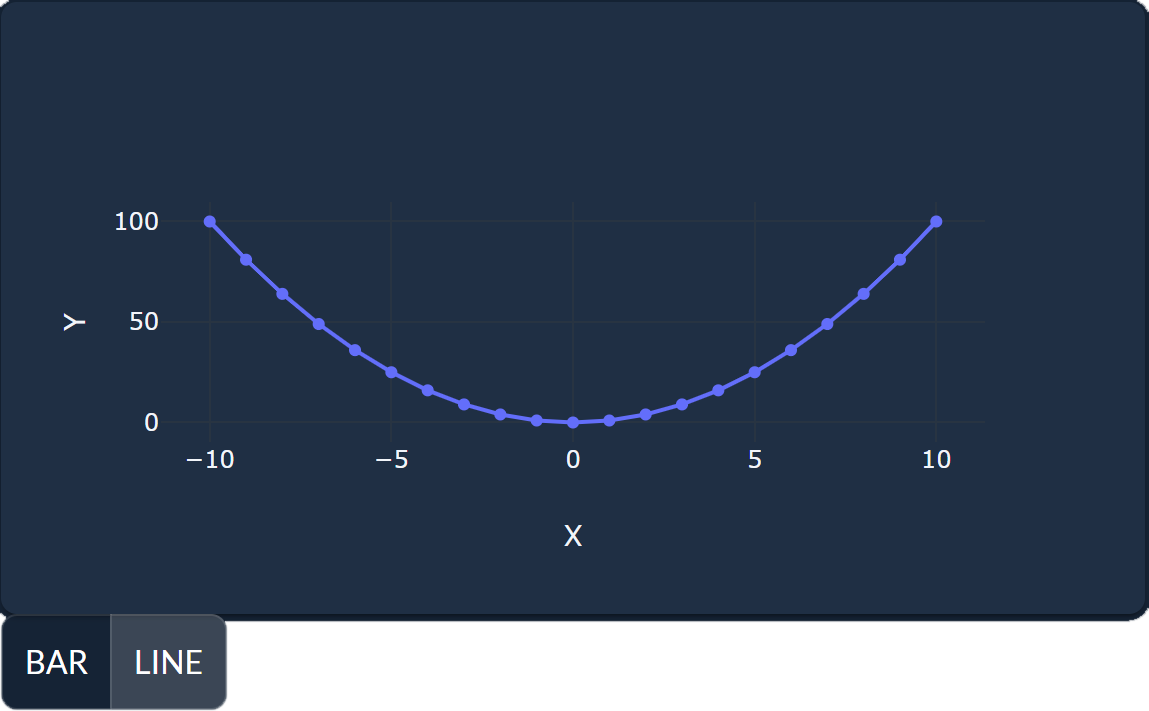
This application displays a chart representing two functions of the values stored in the array
x_range: the squared value and a cosine function.
A toggle control is added to the page to let the user choose the chart type
dynamically: a line chart or a bar chart.
Here is what this application looks like when you run it:
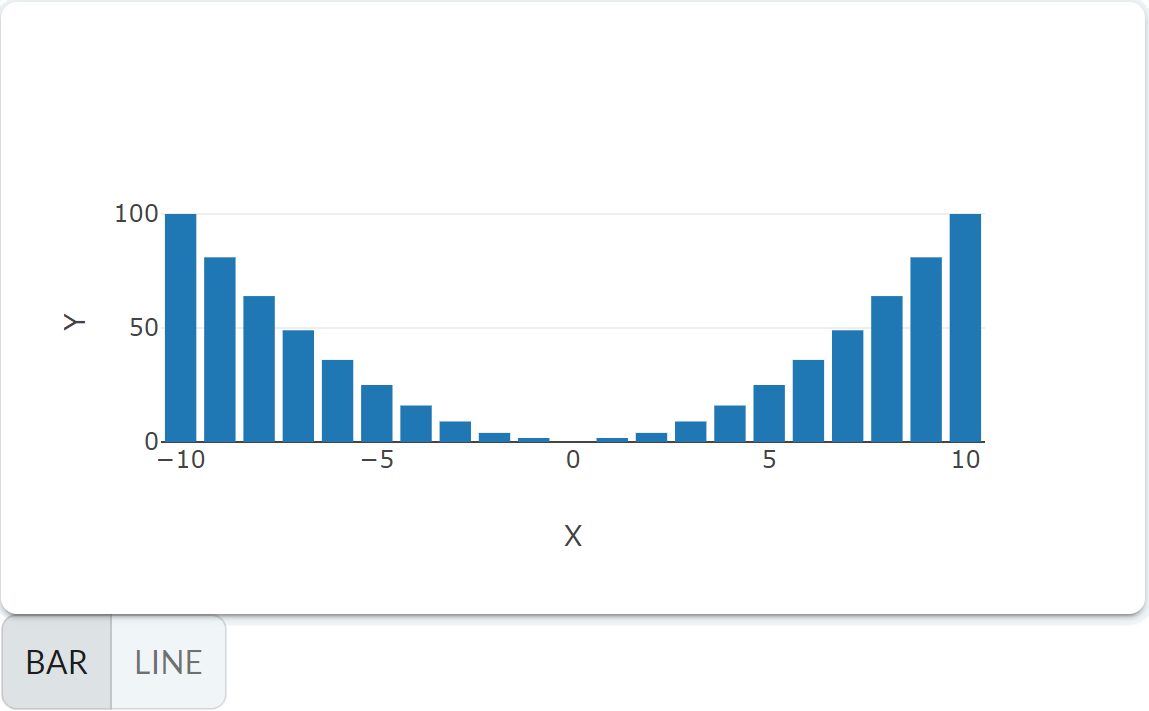
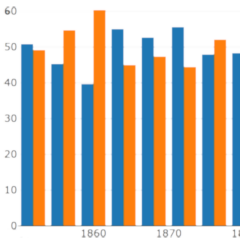
If the user switches the type in the toggle button, this would be the resulting page:
You can see that although the toggle value was changed, the chart was not impacted by the new
setting. That is because the type property is not dynamic.
To display the chart with the new type setting, one would have to refresh the browser page.
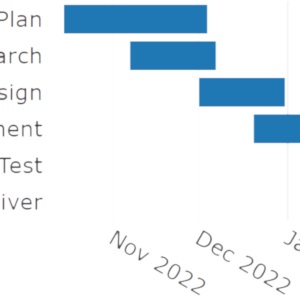
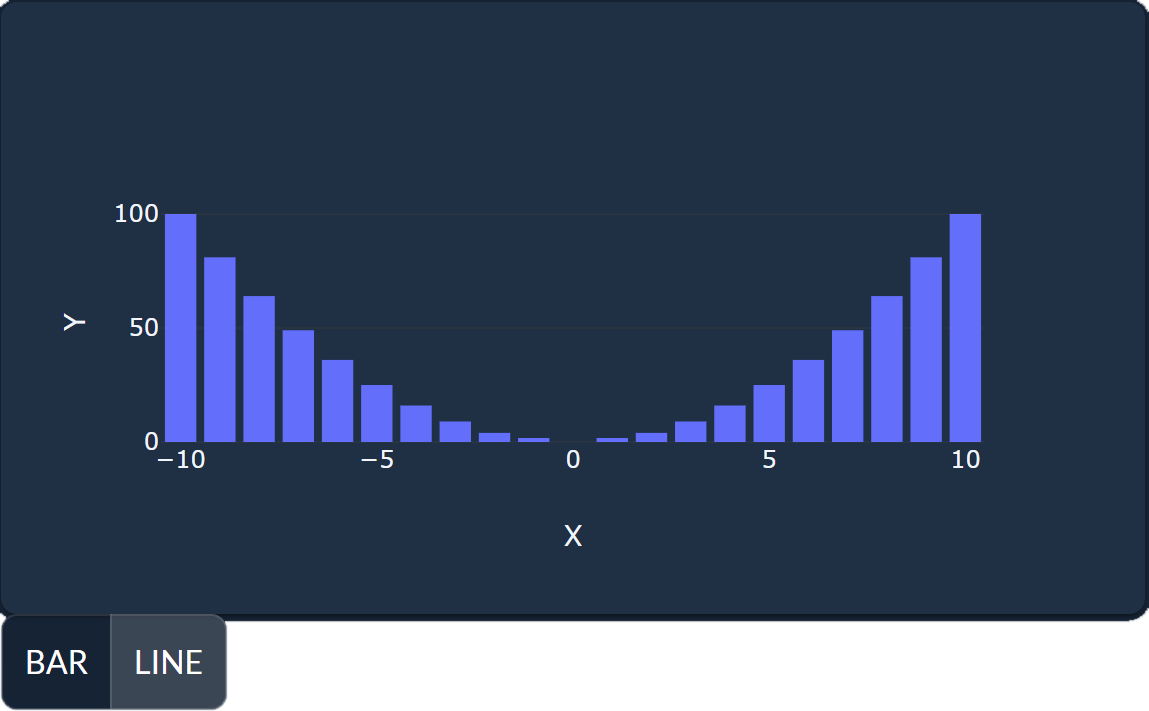
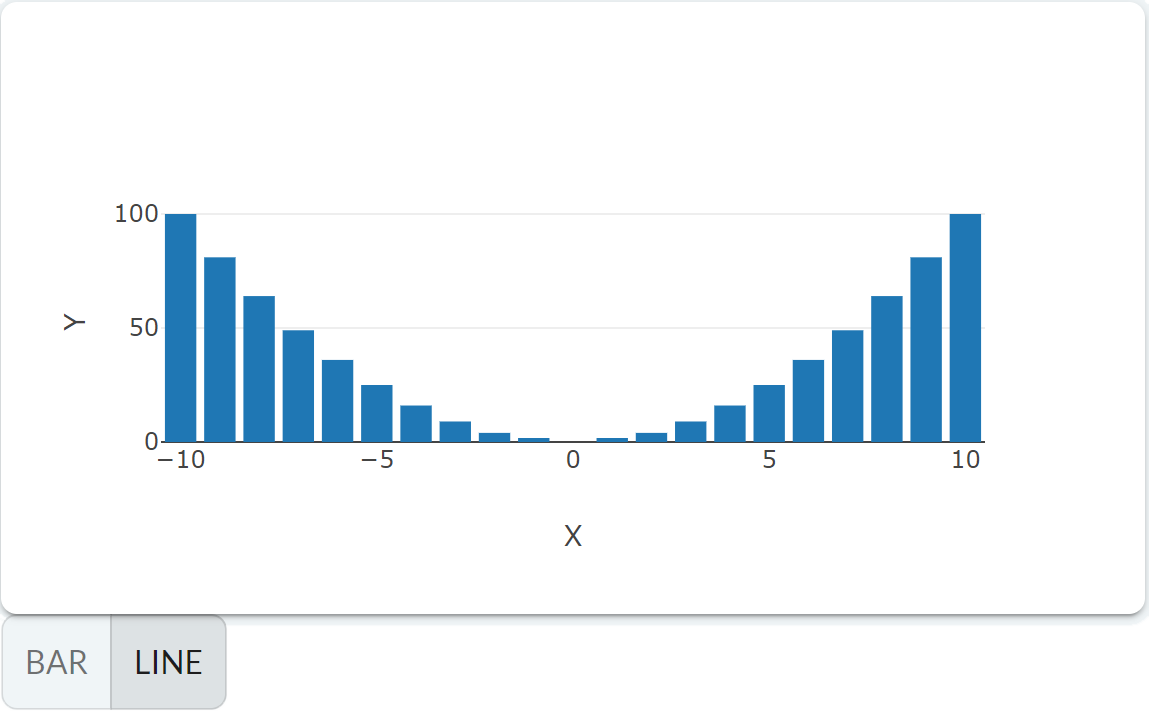
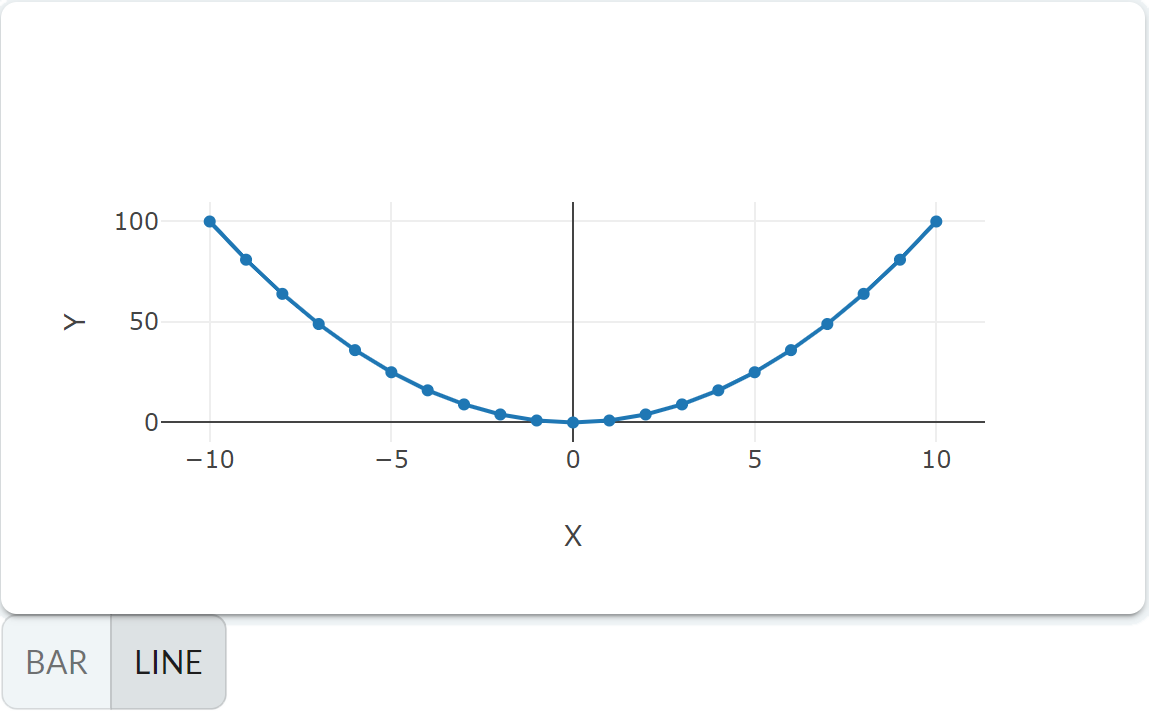
However, Taipy GUI can rebuild and refresh the chart automatically if you set it's rebuild property to True. The Markdown chart definition can be changed to:
<|{data}|chart|type={selected_type[0]}|x=X|y=Y|rebuild|>
If you run the application again, as soon as the user selects the new chart type using the toggle button, the page will reflect the change without explicit refresh:
Styling
All the chart controls are generated with the "taipy-chart" CSS class. You can use this class name to select the charts on your page and apply style.
Stylekit support
The Stylekit provides a specific class that you can use to style charts:
- has-background
When the chart control uses the has-background class, the rendering of the chart background is left to the charting library.
The default behavior is to render the chart transparently.
Usage
Here is a list of several sub-sections that you can check to get more details on a specific domain covered by the chart control: