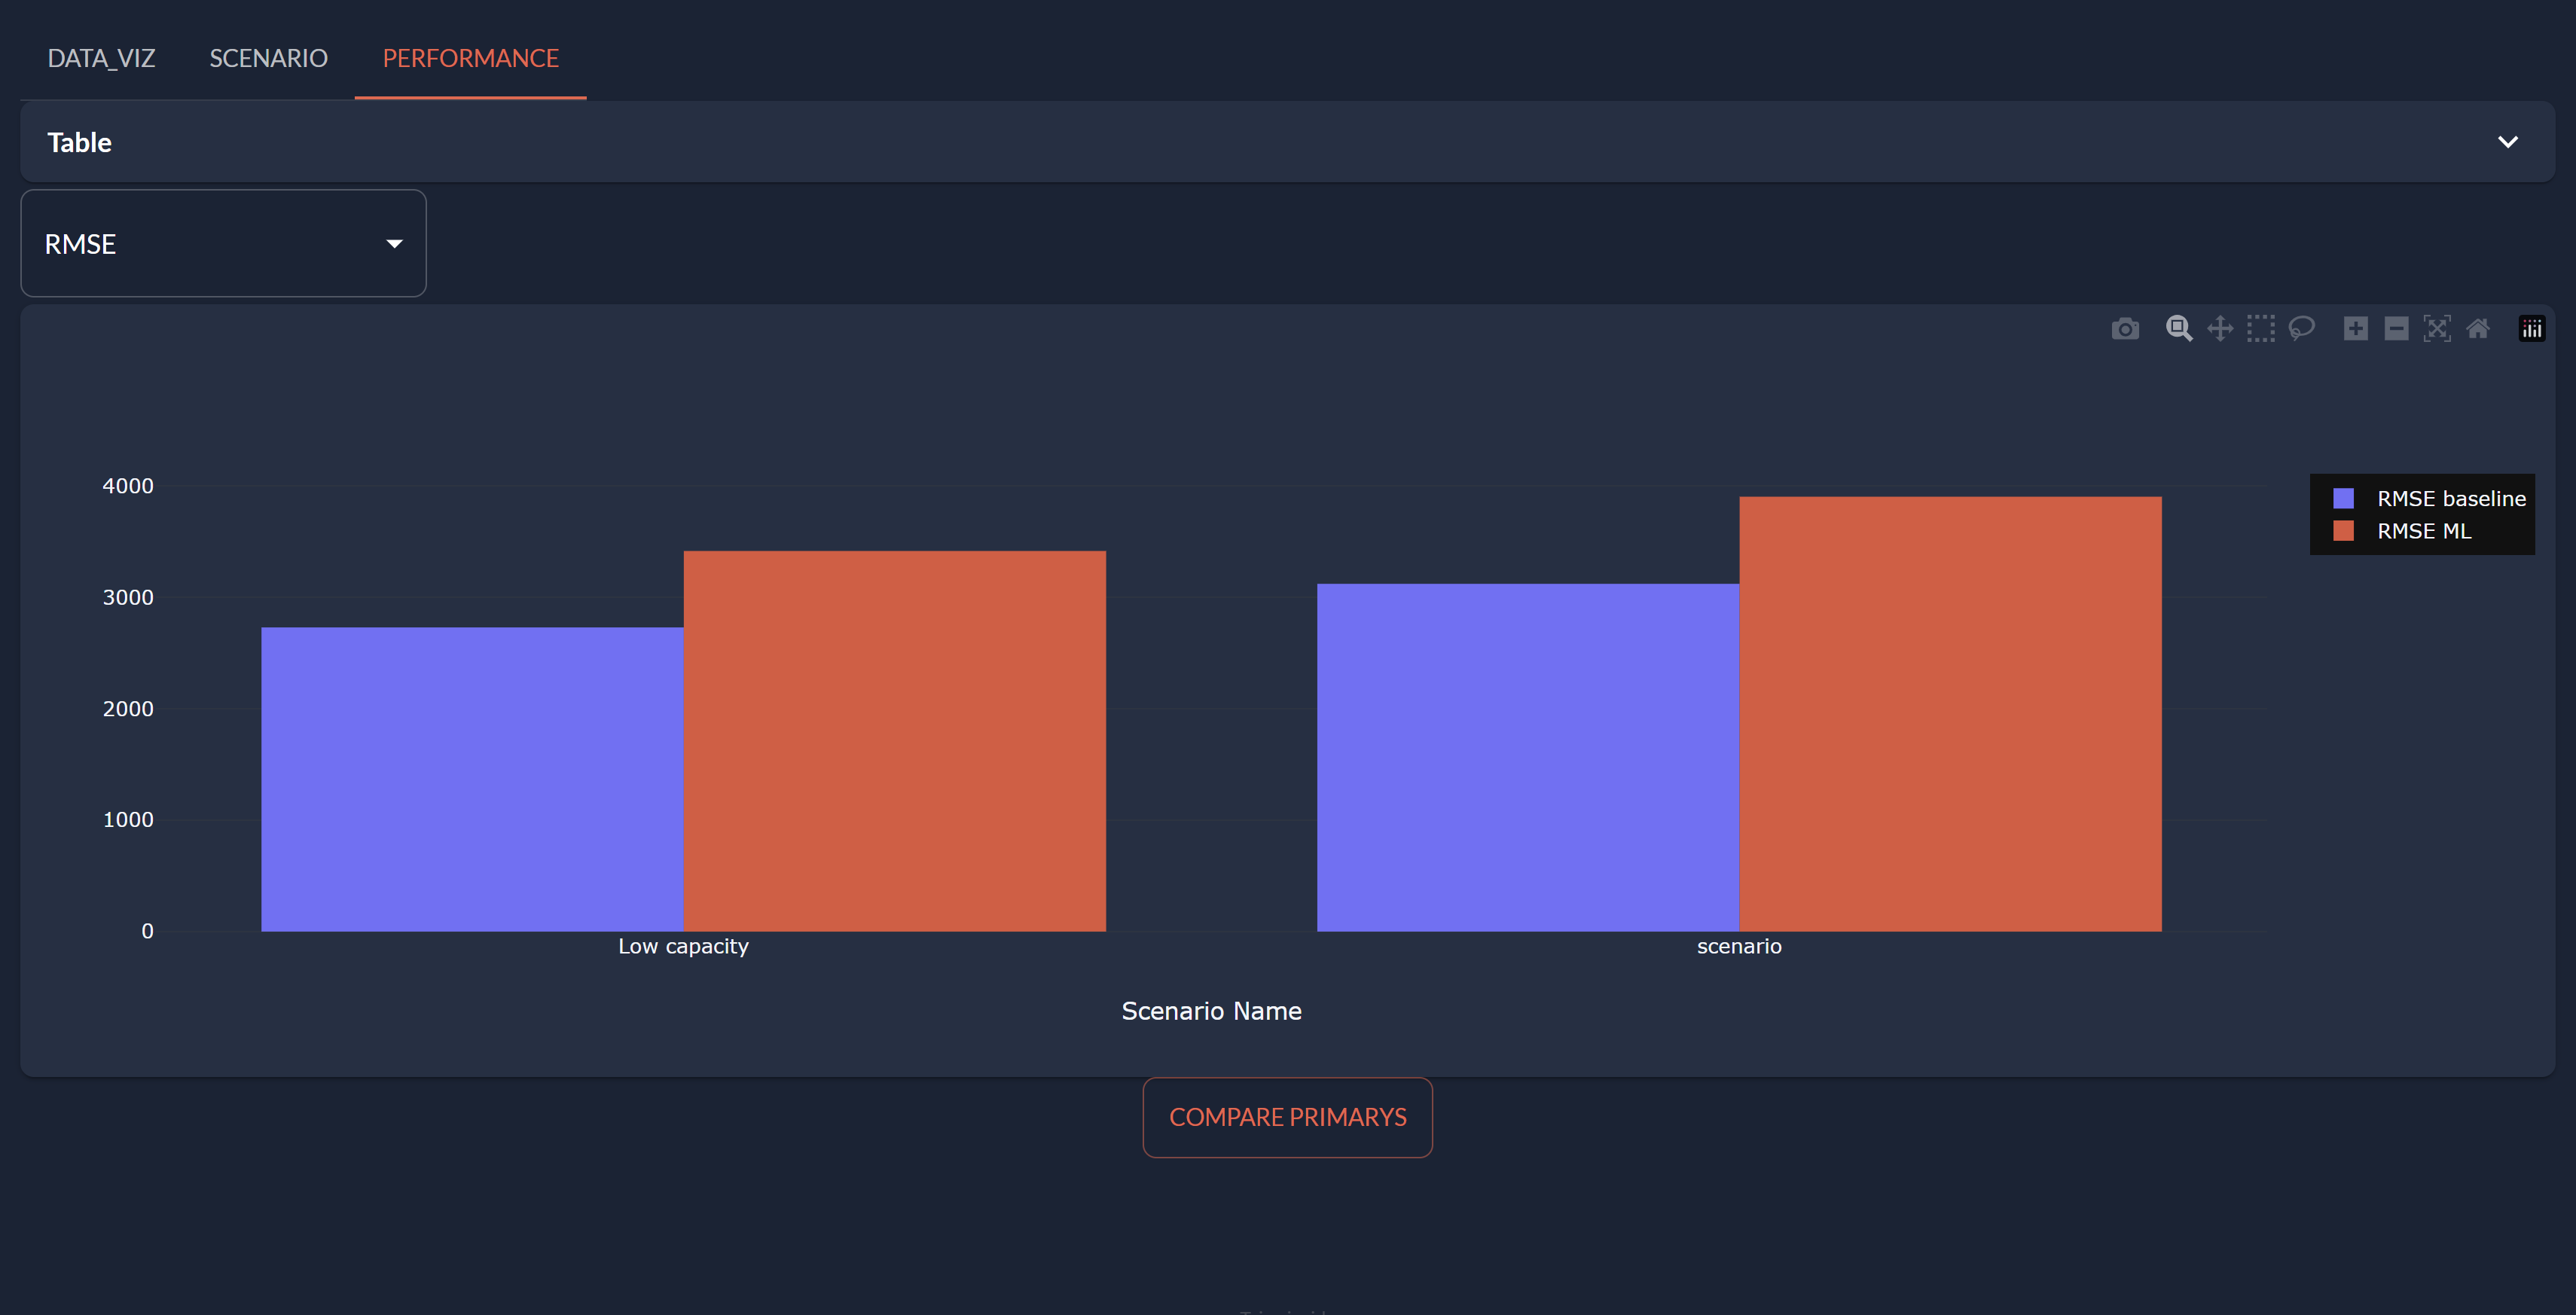
5 - Performance page
The Performance Page is a section of the application that permits users to compare the performance metrics, including Root Mean Squared Error and Mean Absolute Error, across various scenarios. The page displays a table and two bar charts for comparing these metrics between baseline and machine learning predictions.
Markdown
The following Markdown corresponds to the pages/performance/performance.mdfile.
<|part|render={len(comparison_scenario)>0}|

<|Table|expanded=False|expandable|
<|{comparison_scenario}|table|>
|>

<|{selected_metric}|selector|lov={metric_selector}|dropdown|>

<|{comparison_scenario}|chart|type=bar|x=Scenario Name|y[1]=RMSE baseline|y[2]=RMSE ML|render={selected_metric=="RMSE"}|>

<|{comparison_scenario}|chart|type=bar|x=Scenario Name|y[1]=MAE baseline|y[2]=MAE ML|render={selected_metric=="MAE"}|>
|>


<center><|Compare primarys|button|on_action=compare|></center>
The Markdown section defines the layout and components of the Performance Page. It includes the following elements:
- Conditional Rendering:
<|part|render={len(comparison_scenario)>0}|...|>
The part component ensures that certain elements are only rendered when there is data available in the comparison_scenario.
- Table:
<|{comparison_scenario}|table|>
A table that displays the comparison data from the comparison_scenario DataFrame. The table is expandable if the number of rows exceeds the available space.
- Metric Selector:
<|{selected_metric}|selector|lov={metric_selector}|dropdown|>
A dropdown selector that allows users to choose between two metrics: Root Mean Squared Error (RMSE) and Mean Absolute Error (MAE).
- Bar Charts:
<|{comparison_scenario}|chart|type=bar|x=Scenario Name|y[1]=RMSE baseline|y[2]=RMSE ML|...|>
Two bar charts that compare the selected metric (RMSE or MAE) between baseline and machine learning predictions. The charts display the performance metrics for each scenario.
- Compare Button:
<|Compare primarys|button|on_action=compare|>
A button that triggers the "compare" action when clicked. It is used to initiate the comparison process.
Python Code
The following Python code corresponds to the pages/performance/performance.py file.
from taipy.gui import Markdown

import pandas as pd
import taipy as tp

# Initial dataset for comparison
comparison_scenario = pd.DataFrame(columns=["Scenario Name",
                                            "RMSE baseline",
                                            "MAE baseline",
                                            "RMSE ML",
                                            "MAE ML"])


# Selector for metrics
metric_selector = ["RMSE", "MAE"]
selected_metric = metric_selector[0]


def compare(state):
    print("Comparing...")

    # Initialize lists for comparison
    scenario_data = []

    # Go through all the primary scenarios
    all_scenarios = sorted(tp.get_primary_scenarios(), key=lambda x: x.creation_date.timestamp())

    for scenario in all_scenarios:
        rmse_baseline, mae_baseline = scenario.metrics_baseline.read()
        rmse_ml, mae_ml = scenario.metrics_ml.read()


        # Store scenario data in a dictionary
        scenario_data.append({
            "Scenario Name": scenario.name,
            "RMSE baseline": rmse_baseline,
            "MAE baseline": mae_baseline,
            "RMSE ML": rmse_ml,
            "MAE ML": mae_ml
        })

    # Create a DataFrame from the scenario_data list
    state.comparison_scenario = pd.DataFrame(scenario_data)

performance = Markdown("pages/performance/performance.md")
- Global Variables:
The variables comparison_scenario, metric_selector, and selected_metric are initialized. The comparison_scenario DataFrame stores the comparison data, while metric_selector holds the options for the metric selector. selected_metric is initialized with the default metric, which is the first element of the metric_selector list (RMSE).
- Compare Function:
The compare function takes care of the comparison process. This function is triggered when the user clicks
the "Compare" button. It gathers the primary scenarios from the application and then goes through each scenario
to collect the RMSE and MAE metrics for both baseline and machine learning predictions.
The data is then stored in the comparison_scenario DataFrame.
The Performance Page in the Python application enables users to compare the effectiveness of different scenarios in making time series predictions. Users can choose between RMSE and MAE metrics and view the comparison results presented as bar charts. This page serves as a valuable tool for evaluating the efficiency of various prediction scenarios and can assist in making informed decisions based on performance assessments.