Stock Visualization
In the realm of financial markets, data is king. The ability to quickly and easily visualize historical stock data and making predictions is essential for investors and financial analysts. This demo, built with Taipy and powered by the Prophet library, offers a way to achieve this.
Understanding the Application
This one-page demo's primary objective is to illustrate how you can build a forecast data visualization dashboard effortlessly using Taipy. This fully interactive web application can be created with fewer than 120 lines of Python code.
Forecasting stock trends is a vital part of financial analysis. In this demo, Meta's Prophet library offers stock predictions for 1 to 5 years. This predictive feature empowers users to make informed choices with the assistance of Taipy.
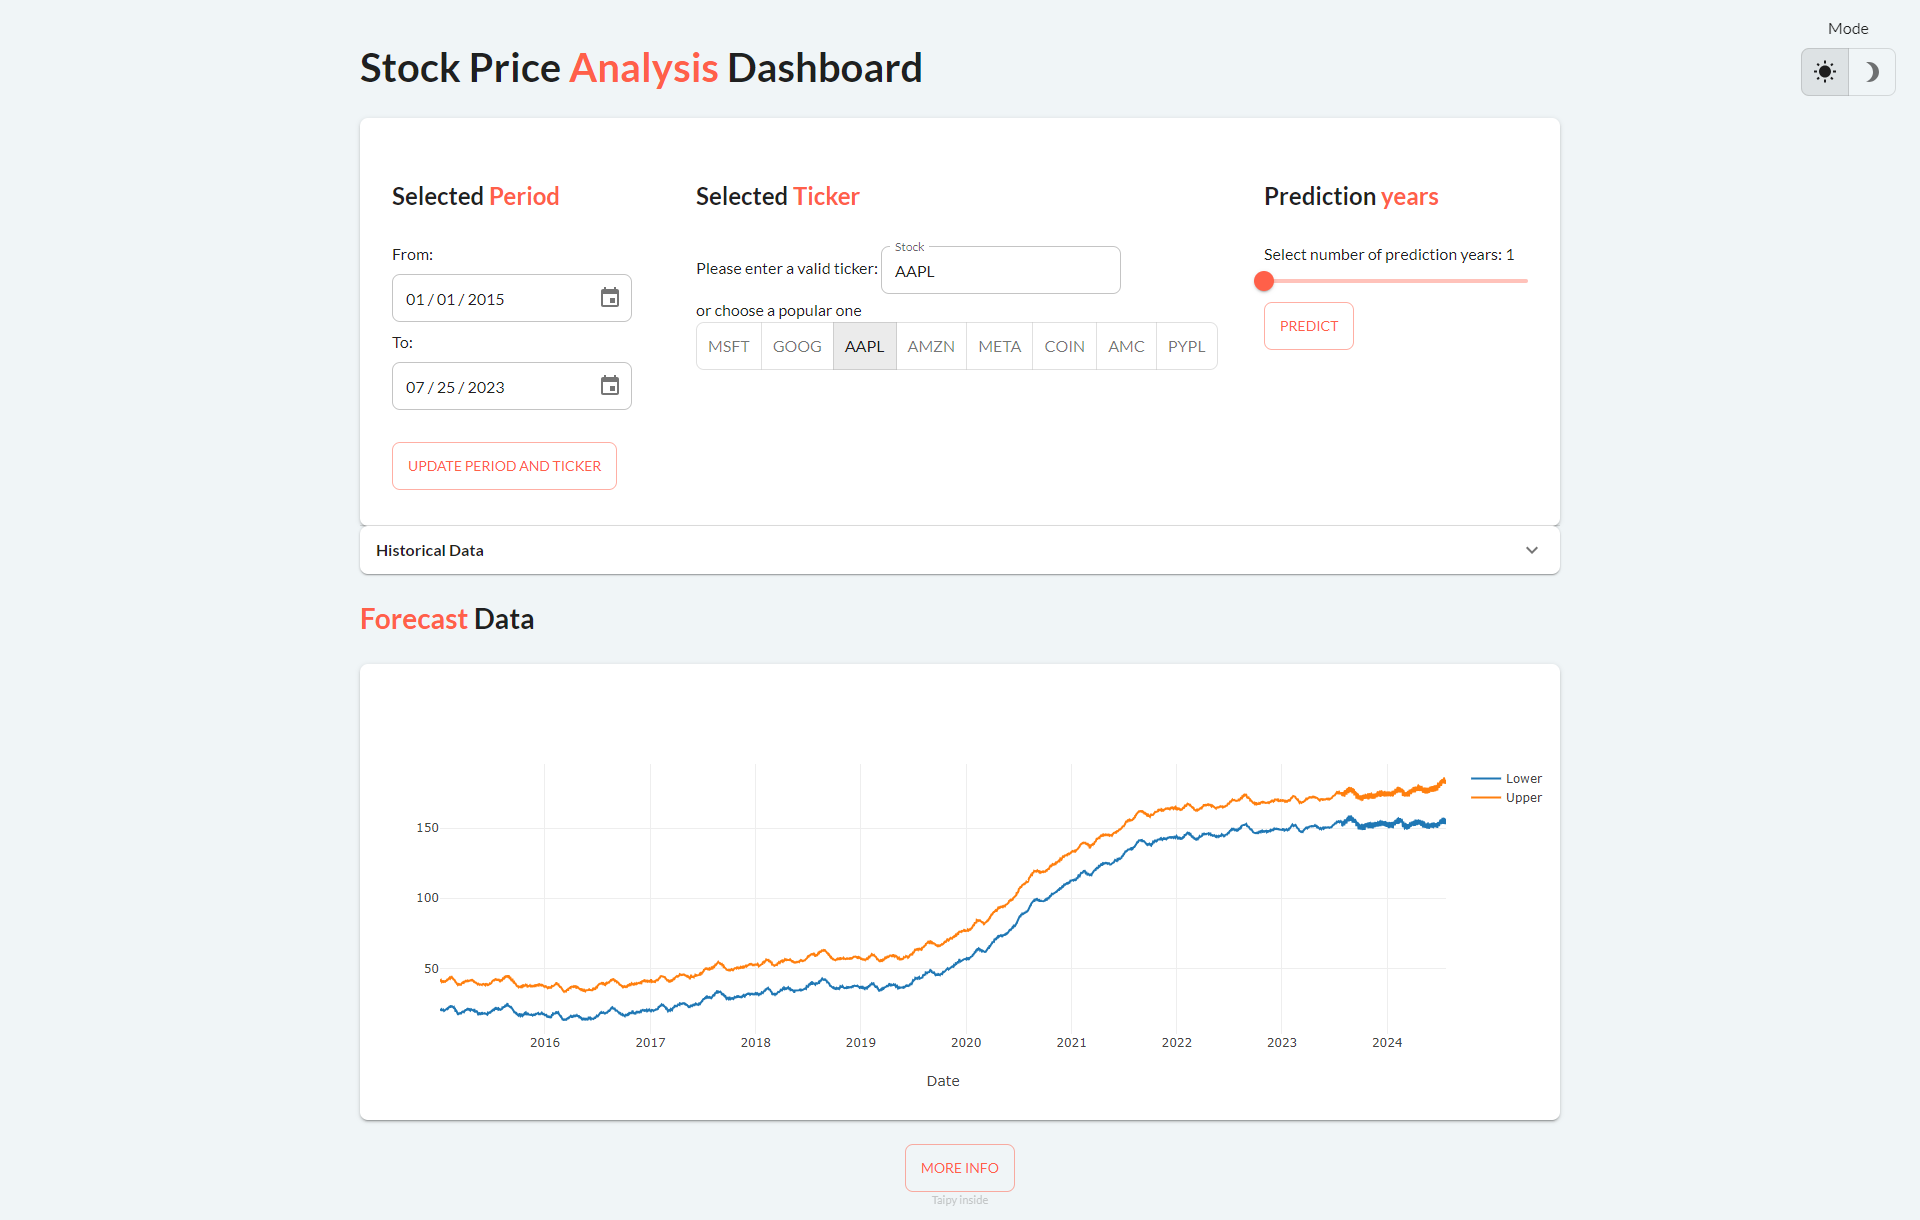
How to use the Application
- Select the ticker you wish to predict
- Open the Historical Data Panel
- Select the period of prediction (from 1 to 5)
- Click on the ‘PREDICT" button
- See your predictions in the Forecast Data Panel...
- Try it repeatedly using different tickers to compare the results.
- Optional: You'll get the prediction ranges as a table by clicking on the "More info" button at the bottom.