6 - Page layouts
Download Step 6 Download the entire code
For Notebooks
The Notebook is available here. In Taipy GUI, the process to execute a Jupyter Notebook is different from executing a Python Script. It is important to check the Notebook content and see the documentation.
You have successfully built a comprehensive forecasting application capable of making predictions for multiple days with various parameters in just a few steps. Nevertheless, there is room for substantial improvement in the page's layout. We'll introduce three new helpful controls to enhance the page's visual appeal. These controls are:
- part: creates a group of text/visual elements.
A useful property of
partis render. If set to False, it will not display the part. This allows the developer to hide a group of visual elements dynamically.
<|part|render={bool_variable}|
Text
Or visual elements...
|>
...
with tgb.part(render="{bool_variable}"):
    tgb.text(...)
    # Or visual elements...
- layout: creates invisible columns where you can put your texts and visual elements. The columns property indicates the width and number of columns. Here, we create three columns of the same width.
<|layout|columns=1 1 1|
Button in first column <|Press|button|>

Second column

Third column
|>
 with tgb.layout("1 1 1"):
    with tgb.part(render="{bool_variable}"):
        tgb.text("Button in first column")
        tgb.buttton("Press")

    tgb.text("Second column")

    tgb.text("Third column")

-
expandable: creates a block that can expand or shrink.
Back to the code
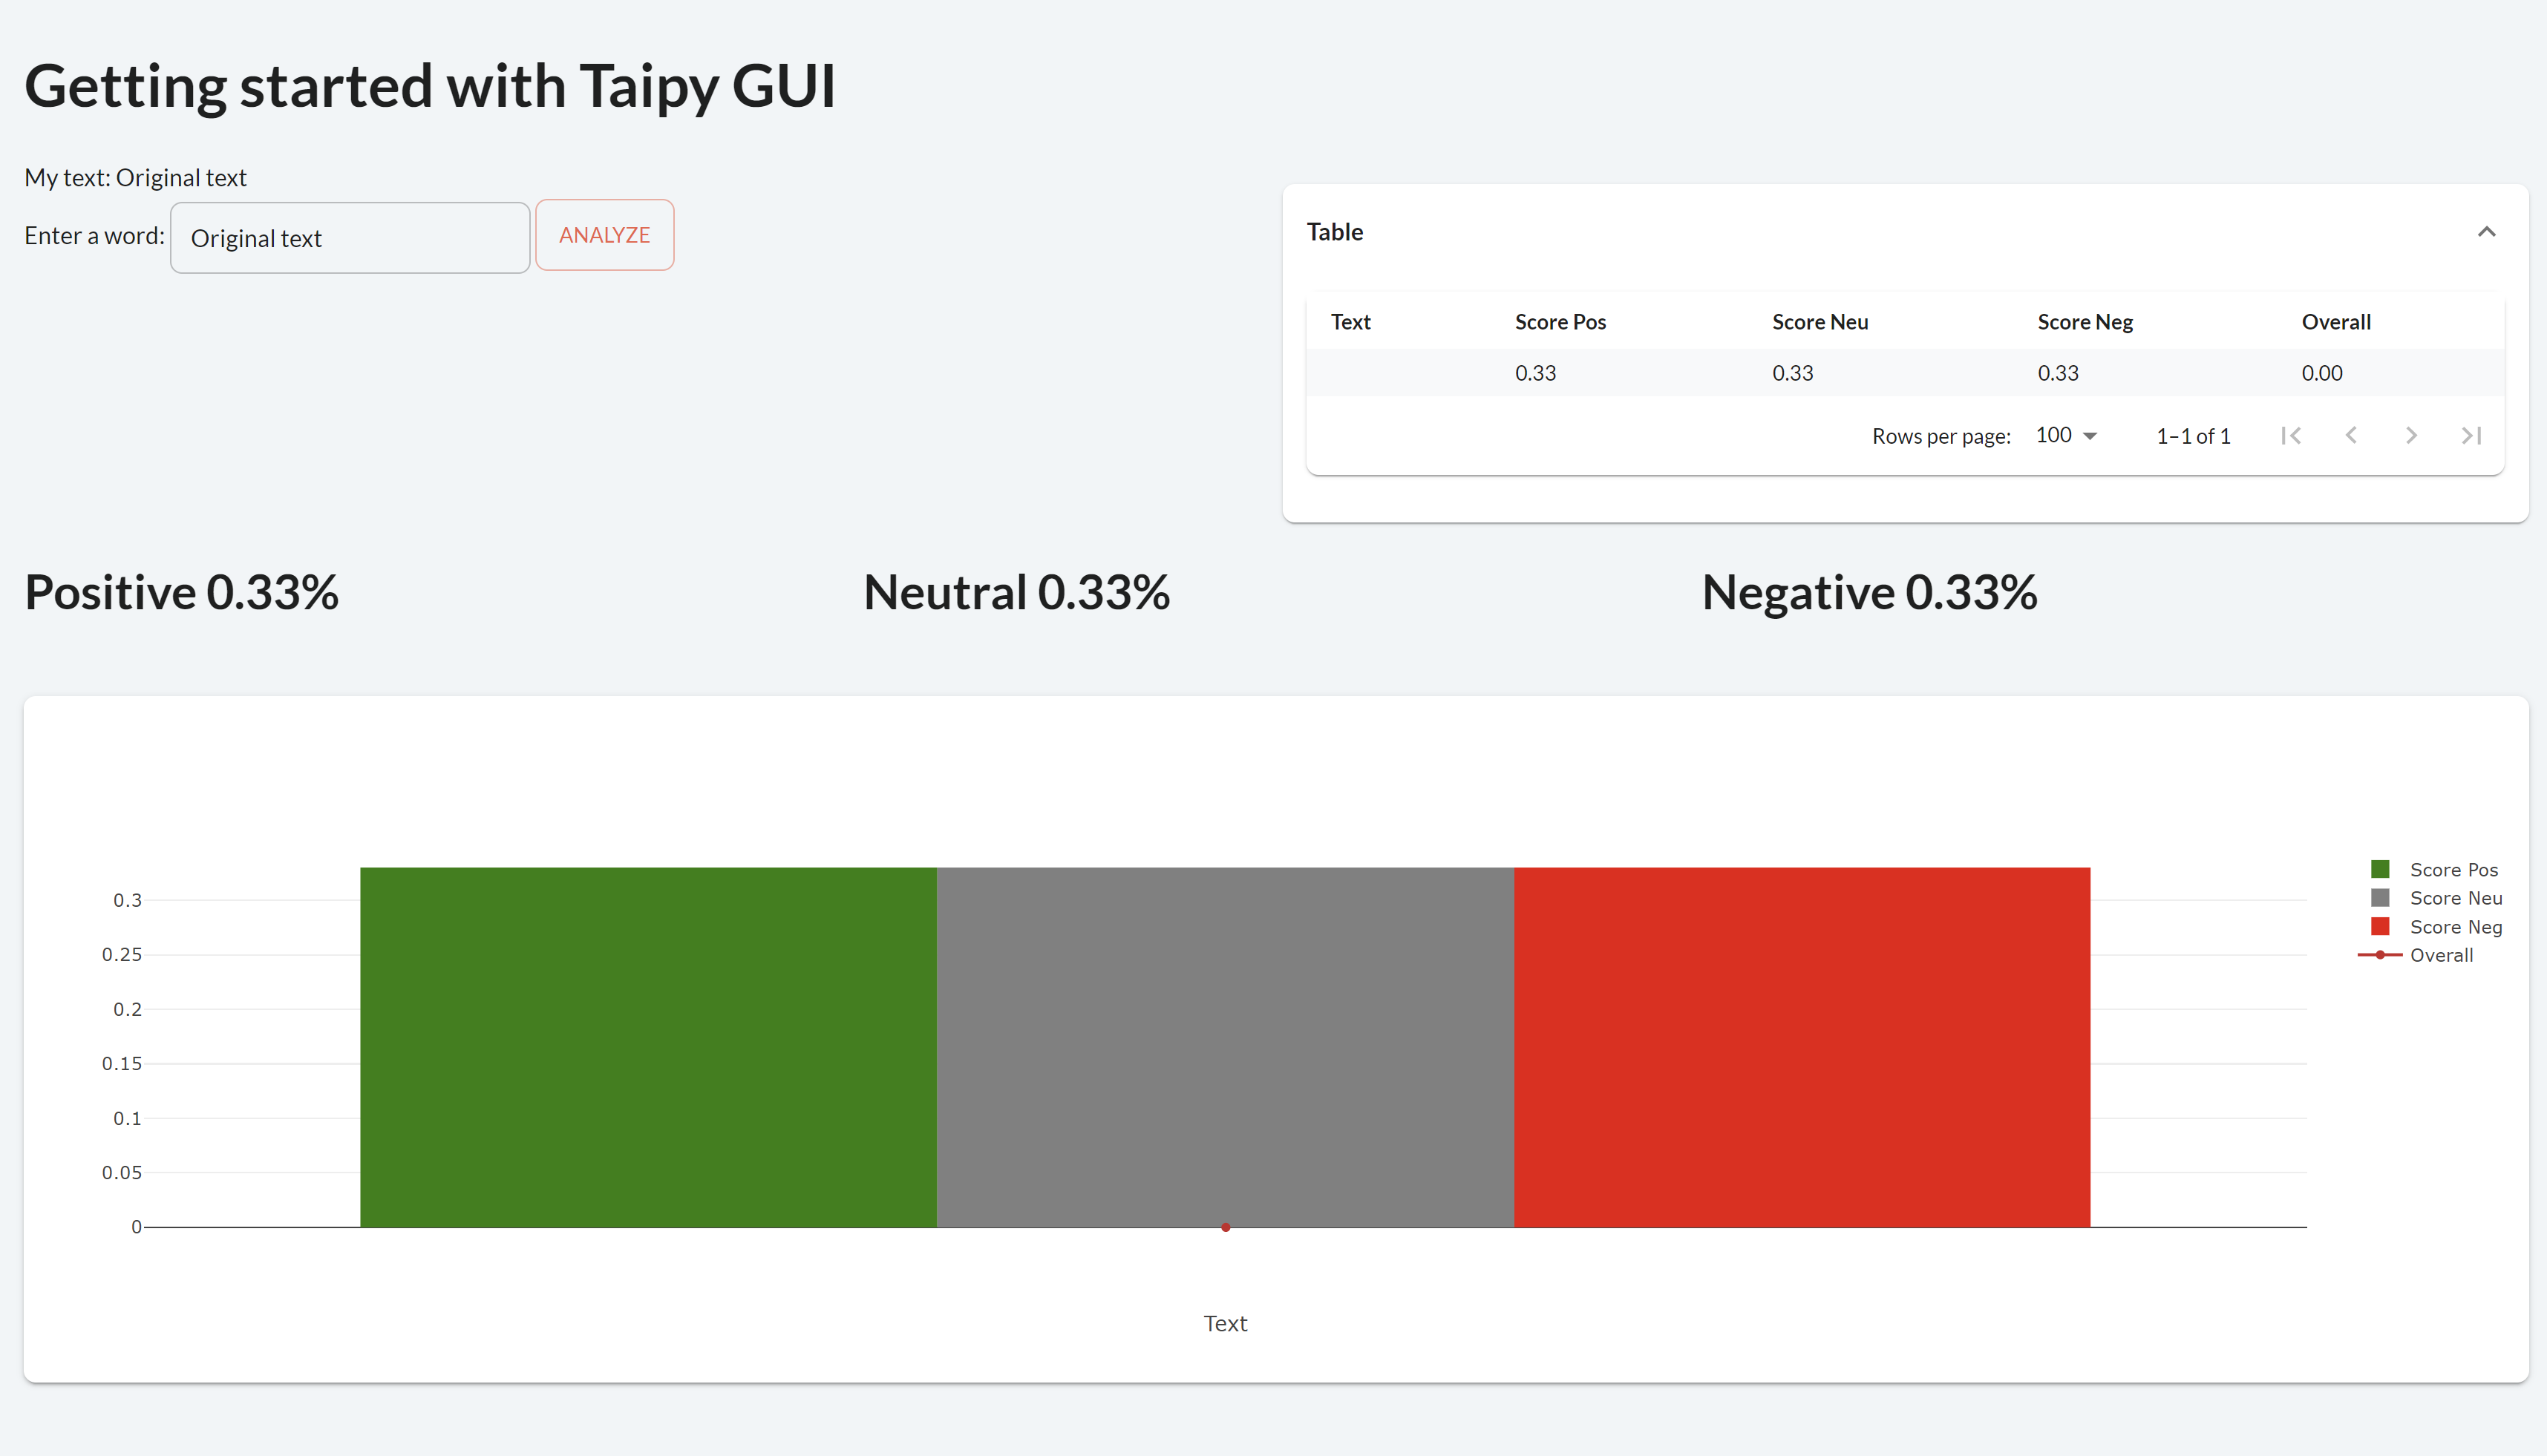
page = """
<|toggle|theme|>
# Getting started with Taipy GUI
<|layout|columns=1 1|
<|
My text: <|{text}|>
Enter a word:
<|{text}|input|>
<|Analyze|button|on_action=local_callback|>
|>
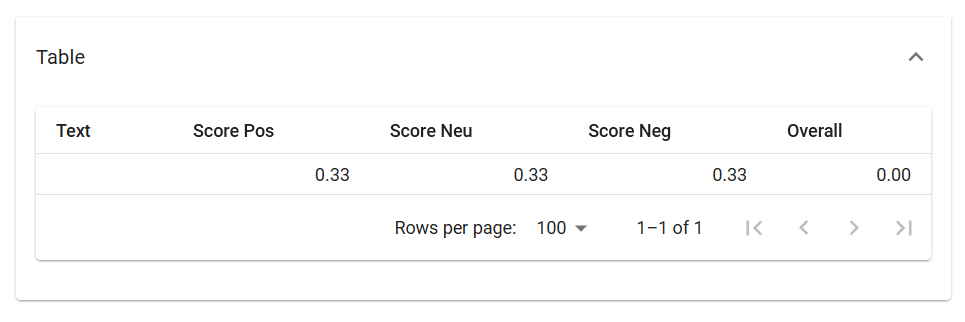
<|Table|expandable|
<|{dataframe}|table|width=100%|>
|>
|>
<|layout|columns=1 1 1|
## Positive <|{np.mean(dataframe['Score Pos'])}|text|format=%.2f|raw|>
## Neutral <|{np.mean(dataframe['Score Neu'])}|text|format=%.2f|raw|>
## Negative <|{np.mean(dataframe['Score Neg'])}|text|format=%.2f|raw|>
|>
<|{dataframe}|chart|type=bar|x=Text|y[1]=Score Pos|y[2]=Score Neu|y[3]=Score Neg|y[4]=Overall|color[1]=green|color[2]=grey|color[3]=red|type[4]=line|>
"""
with tgb.Page() as page:
    with tgb.layout(columns="1 1"):
        with tgb.part():
            tgb.text("My text: {text}")
            tgb.input("{text}")
            tgb.button("Analyze", on_action=local_callback)

        with tgb.expandable("Table"):
            tgb.table("{dataframe}", number_format="%.2f")

    with tgb.layout(columns="1 1 1"):
        with tgb.part():
            tgb.text("## Positive", mode="md")
            tgb.text("{np.mean(dataframe['Score Pos'])}", format="%.2f")
        with tgb.part():
            tgb.text("## Neutral", mode="md")
            tgb.text("{np.mean(dataframe['Score Neu'])}", format="%.2f")
        with tgb.part():
            tgb.text("## Negative", mode="md")
            tgb.text("{np.mean(dataframe['Score Neg'])}", format="%.2f")

    tgb.chart("{dataframe}", type="bar", x="Text", y__1="Score Pos", y__2="Score Neu", y__3="Score Neg", y__4="Overall",
            color__1="green", color__2="grey", color__3="red", type__4="line")