Churn Classification
In the fast-paced world of business, retaining customers is a top priority because keeping current customers is often more cost-effective than acquiring new ones. By identifying customers who may leave early and applying retention strategies, businesses can lower churn rates and boost customer loyalty.
Understanding the Application
The application comprises four pages accessible via the left panel.
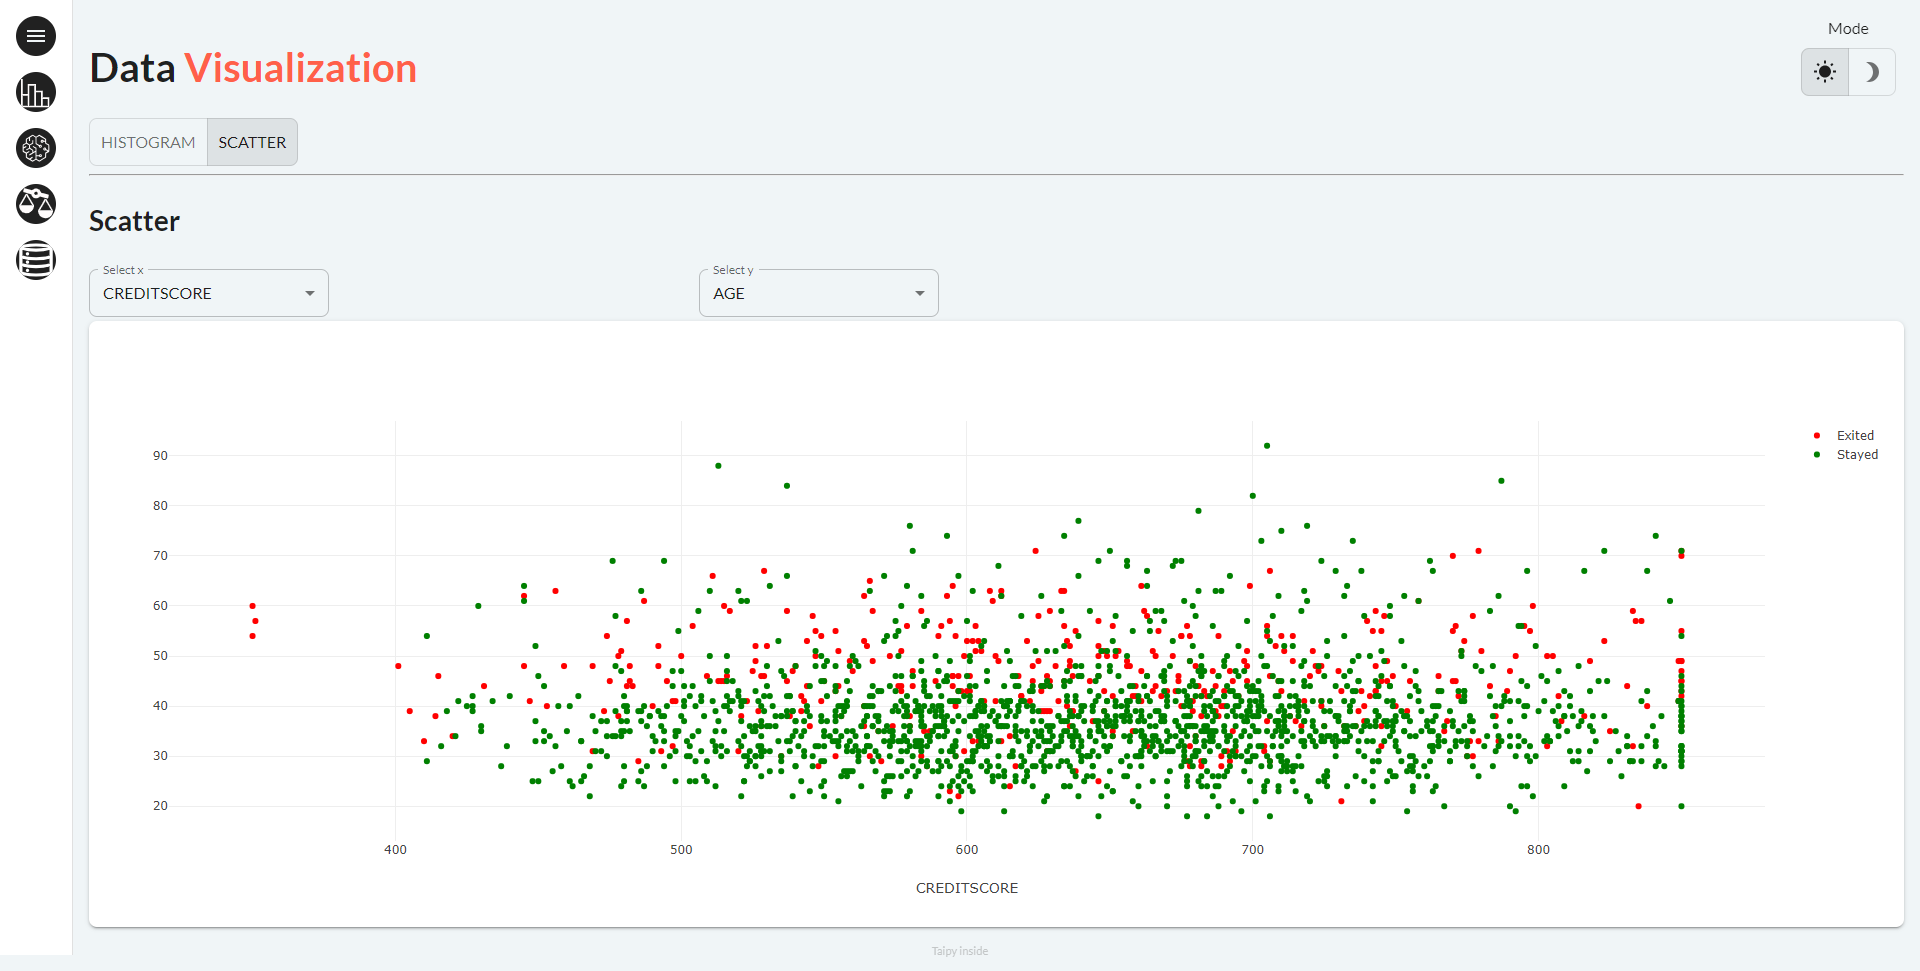
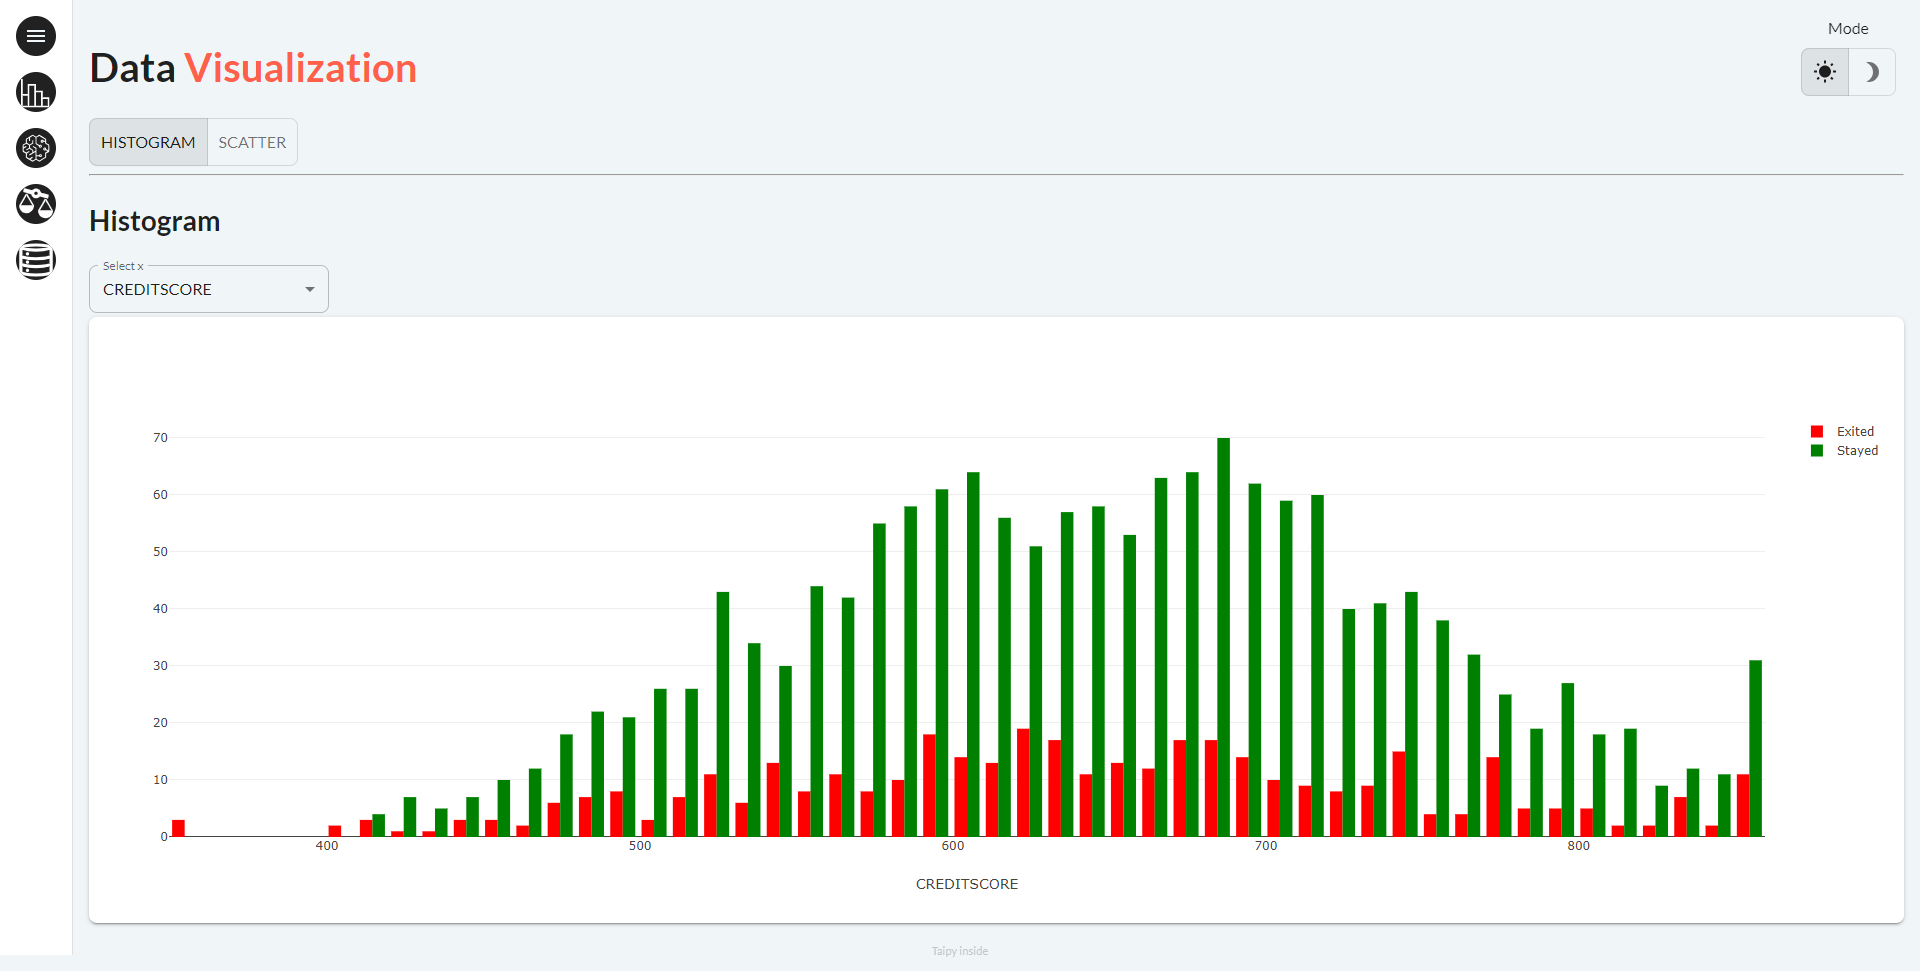
Page 1: Data Visualization
This page allows to conduct an Exploratory Data Analysis (EDA). You have the option to select among two types of graph (scatter plot or histogram) and choose the data content you want to explore with the "Select x" selector.
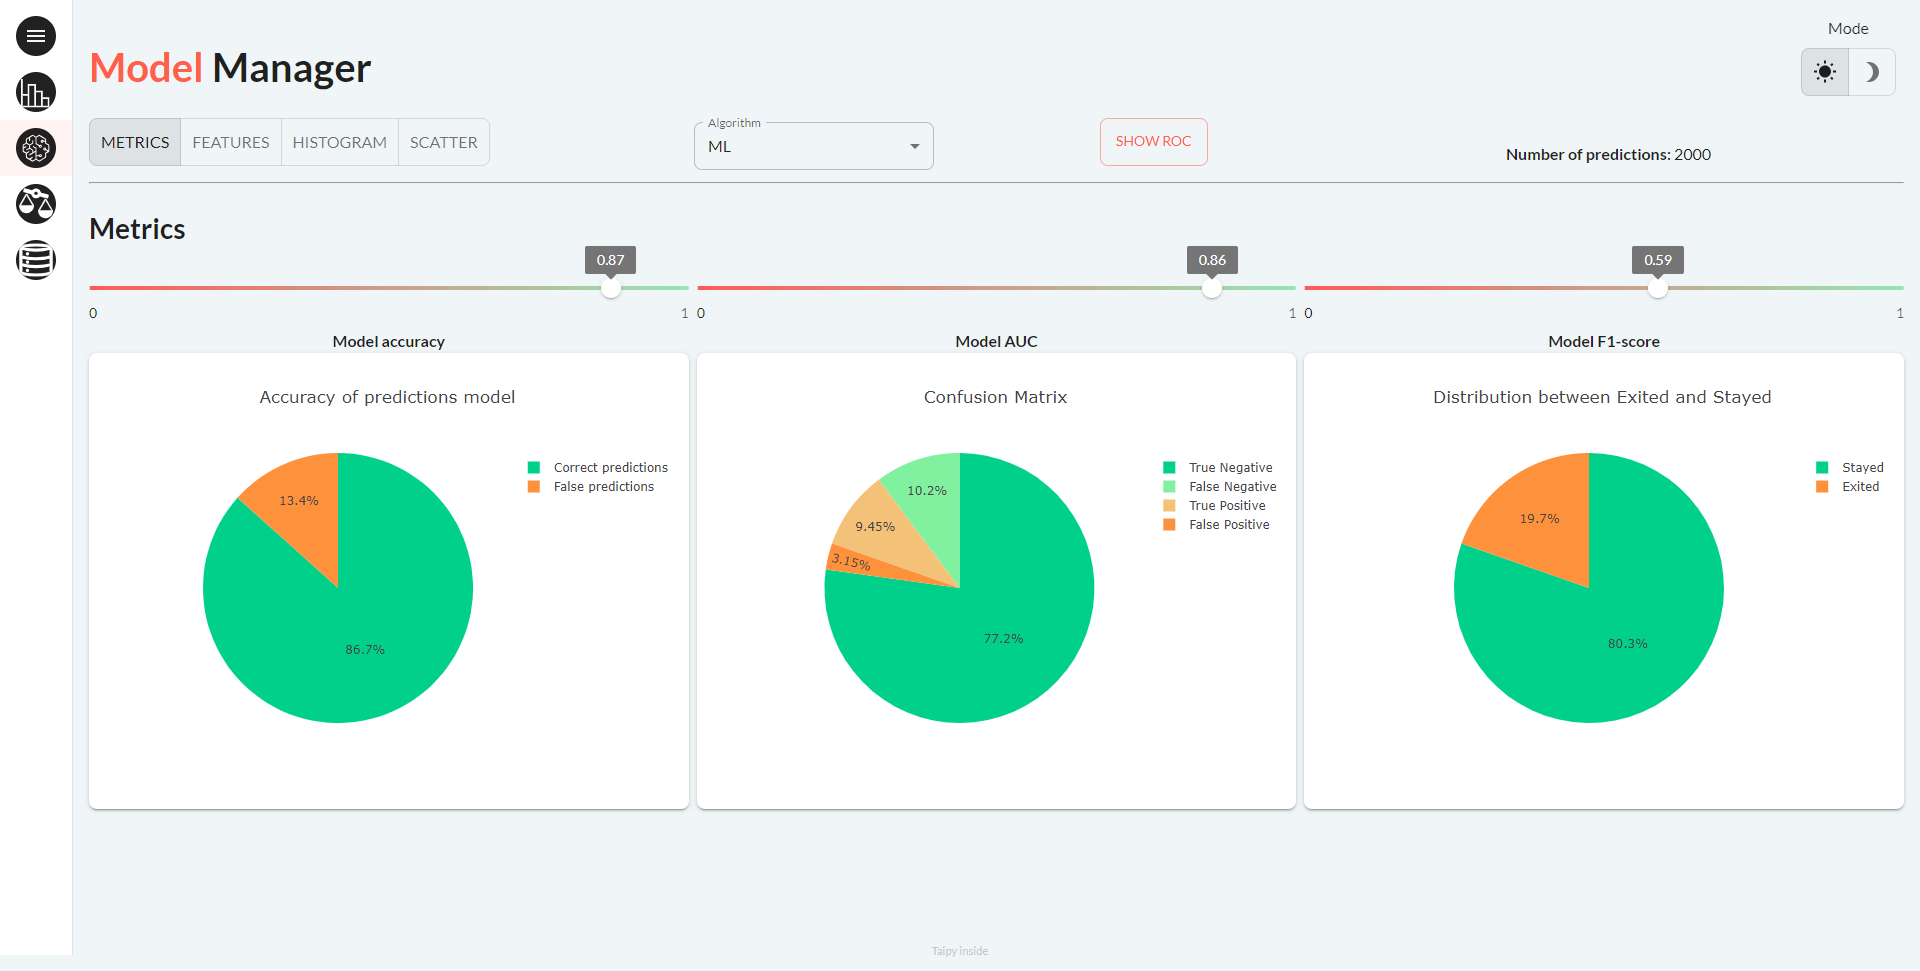
Page 2: Model Manager
Here, users can access the performance results of the selected algorithm. Users can choose: - Classification algorithm amongst 2 options (a ‘baseline or ‘ML’) - A chart type to visualize predictions on a validation dataset.
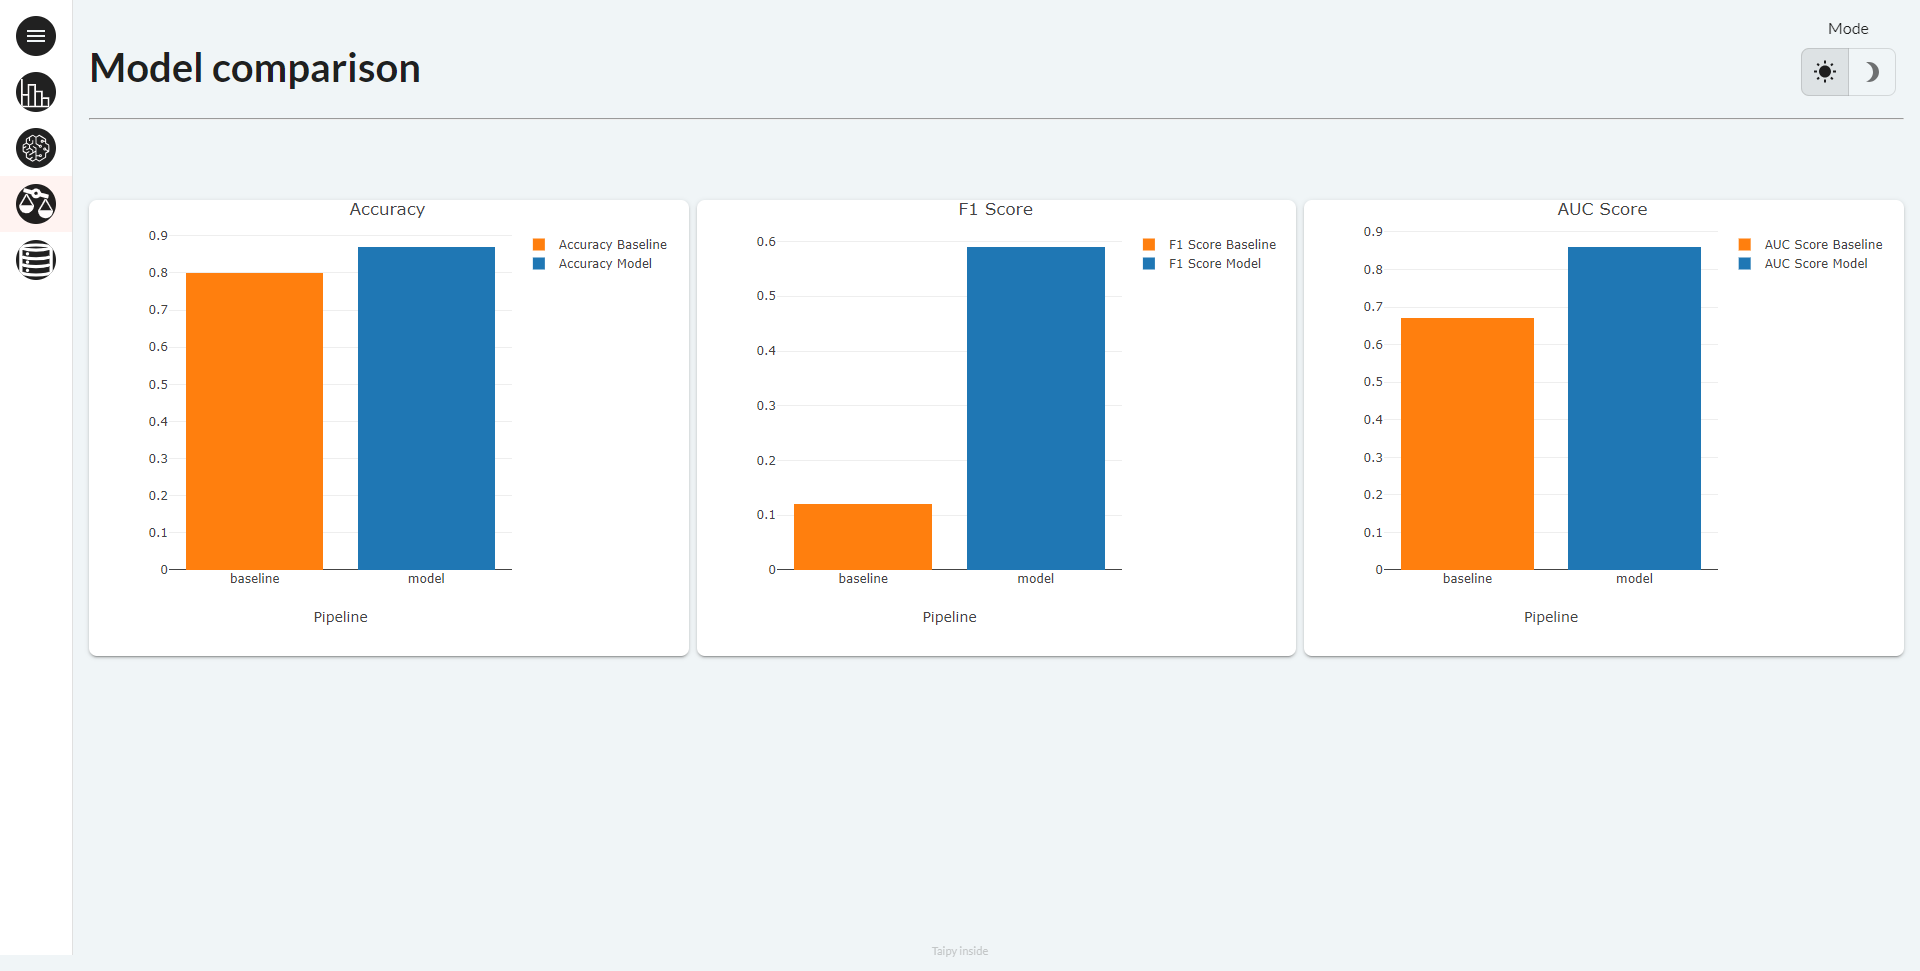
Page 3: Model Comparison
This page displays the performance of two models side by side, facilitating easy comparison.
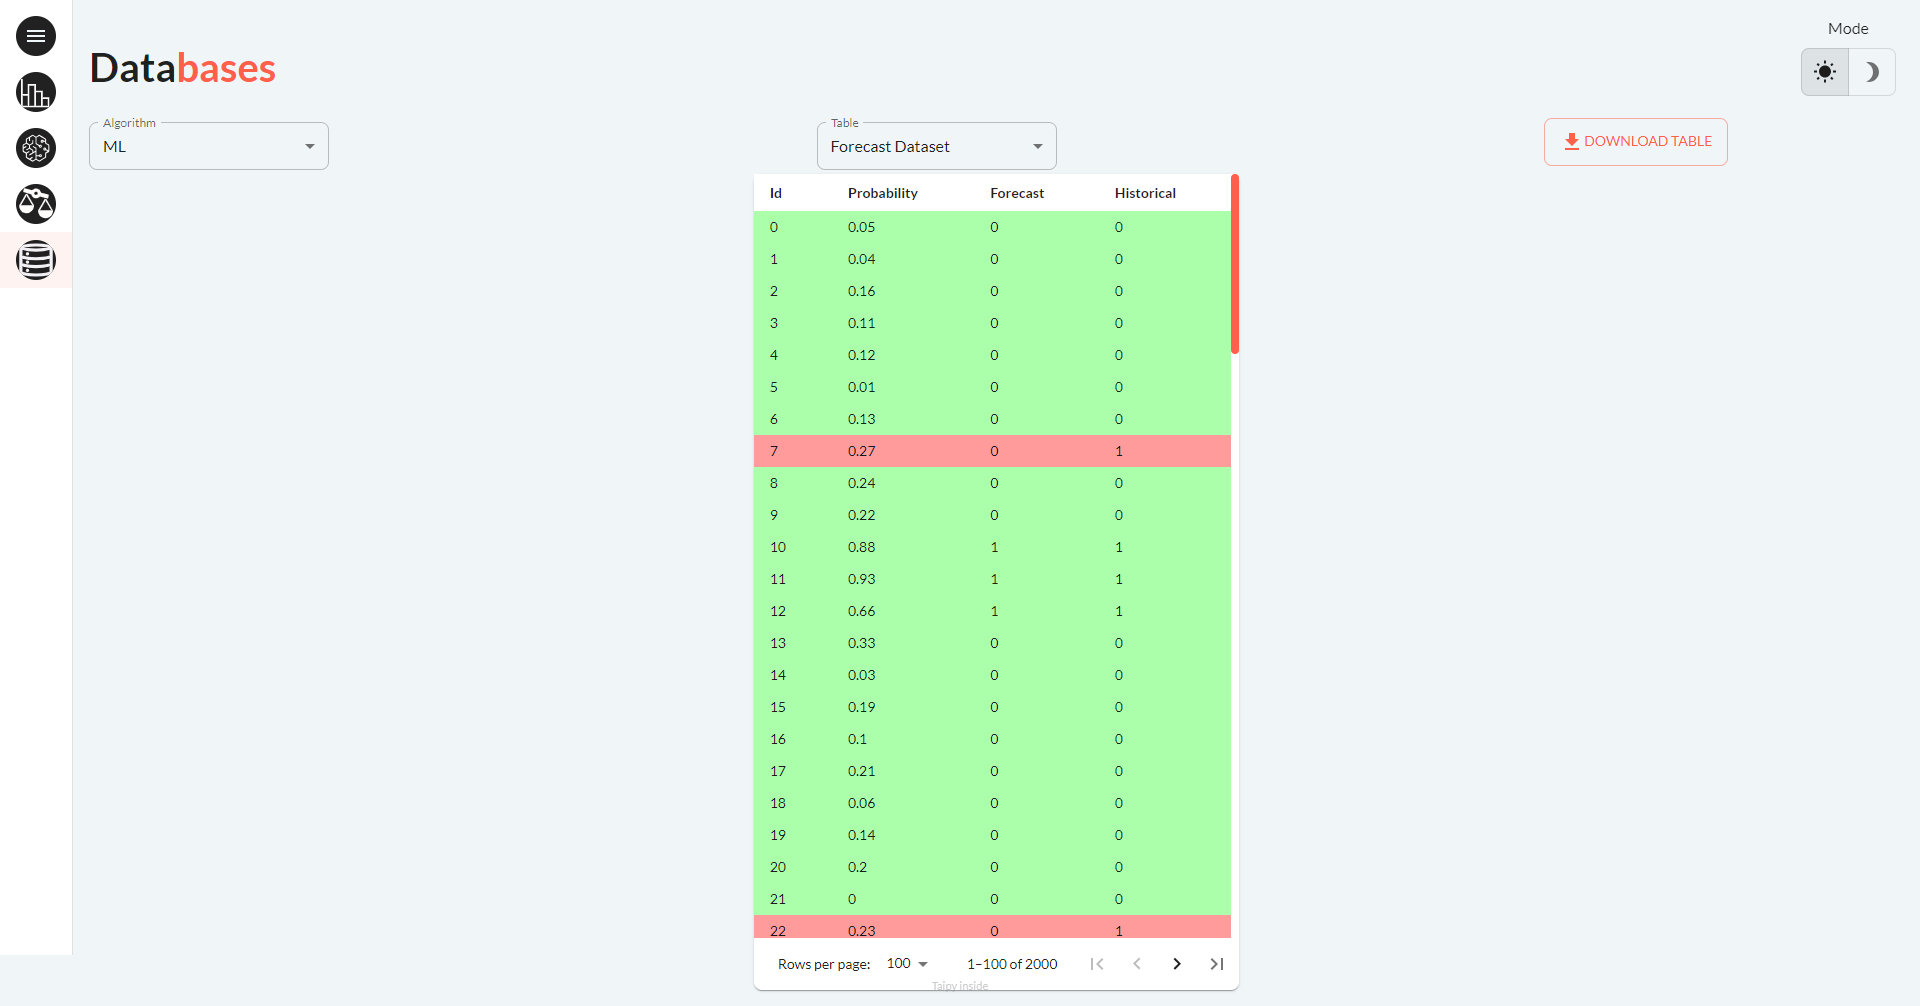
Page 4: Databases
Through this page, access to various datasets, including: training dataset, test dataset, forecast, scoring results, and the Confusion Matrix of the selected algorithm. Users can also download specified data frames as CSV files.