Sales Dashboard
This demo allows users to extract data from an Excel file and derive meaningful insights. When Users apply filters based on city, customer type, and gender, Taipy automatically refreshes the two charts: "Sales by hour" and "Sales by product".
Understanding the Application
This demo is a one-page application.
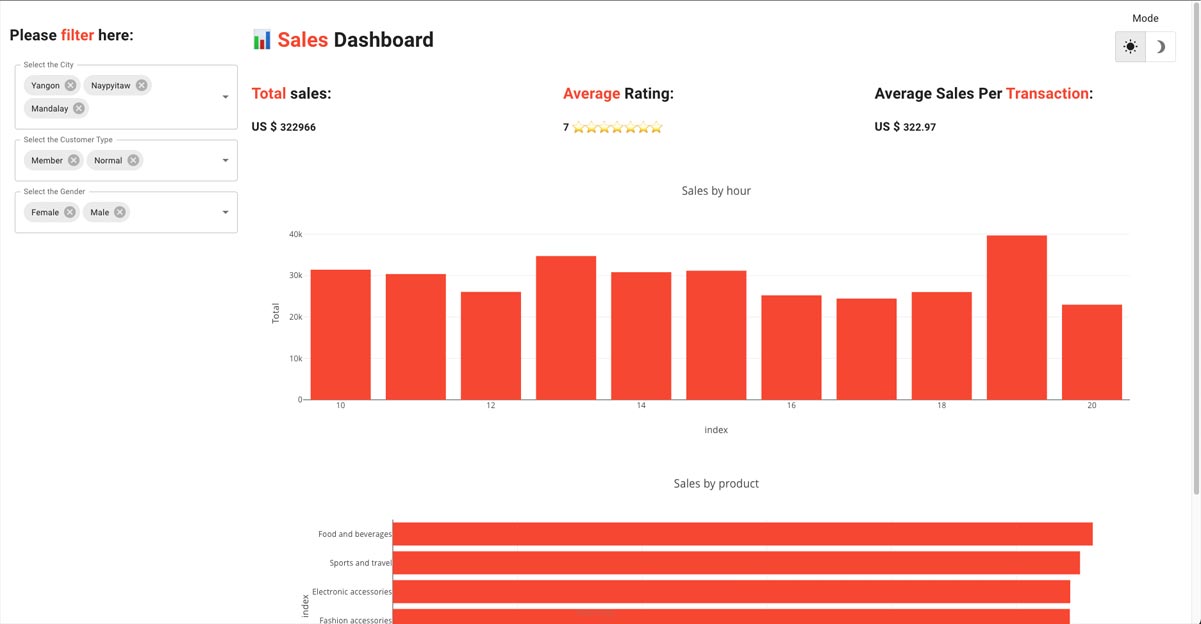
The dashboard includes filters and two interactive charts: "Sales by hour" and "Sales by product". These charts make it easy to spot trends, patterns, etc.
$pip install taipy
Source
The idea, as well as part of the code of this application, come from Sven Bosau. The original code can be found here. It was recreated using Taipy.