Optimize Bar Cut Sizes
This demo showcases how to optimize the bar-cutting process to minimize waste. Bar-cutting optimization minimizes waste by choosing optimal cutting patterns. This is crucial in industries with significant material costs such as Steel, Timber, etc.
Understand the Application
The application comprises five pages accessible via the left panel. To visualize them expand the menu list by just clicking inside this left panel
Page 1: Bar Visualization
- Load the selected dataset by choosing from two cases ("Case 1" or "Case 2").
- Select one algorithm (amongst the two algorithms proposed): the "Baseline" or the "Optim Model".
- Click on "RUN"
- Within seconds, the results get displayed, highlighting material loss in blue on a bar chart.
- Switch algorithms to compare material waste.
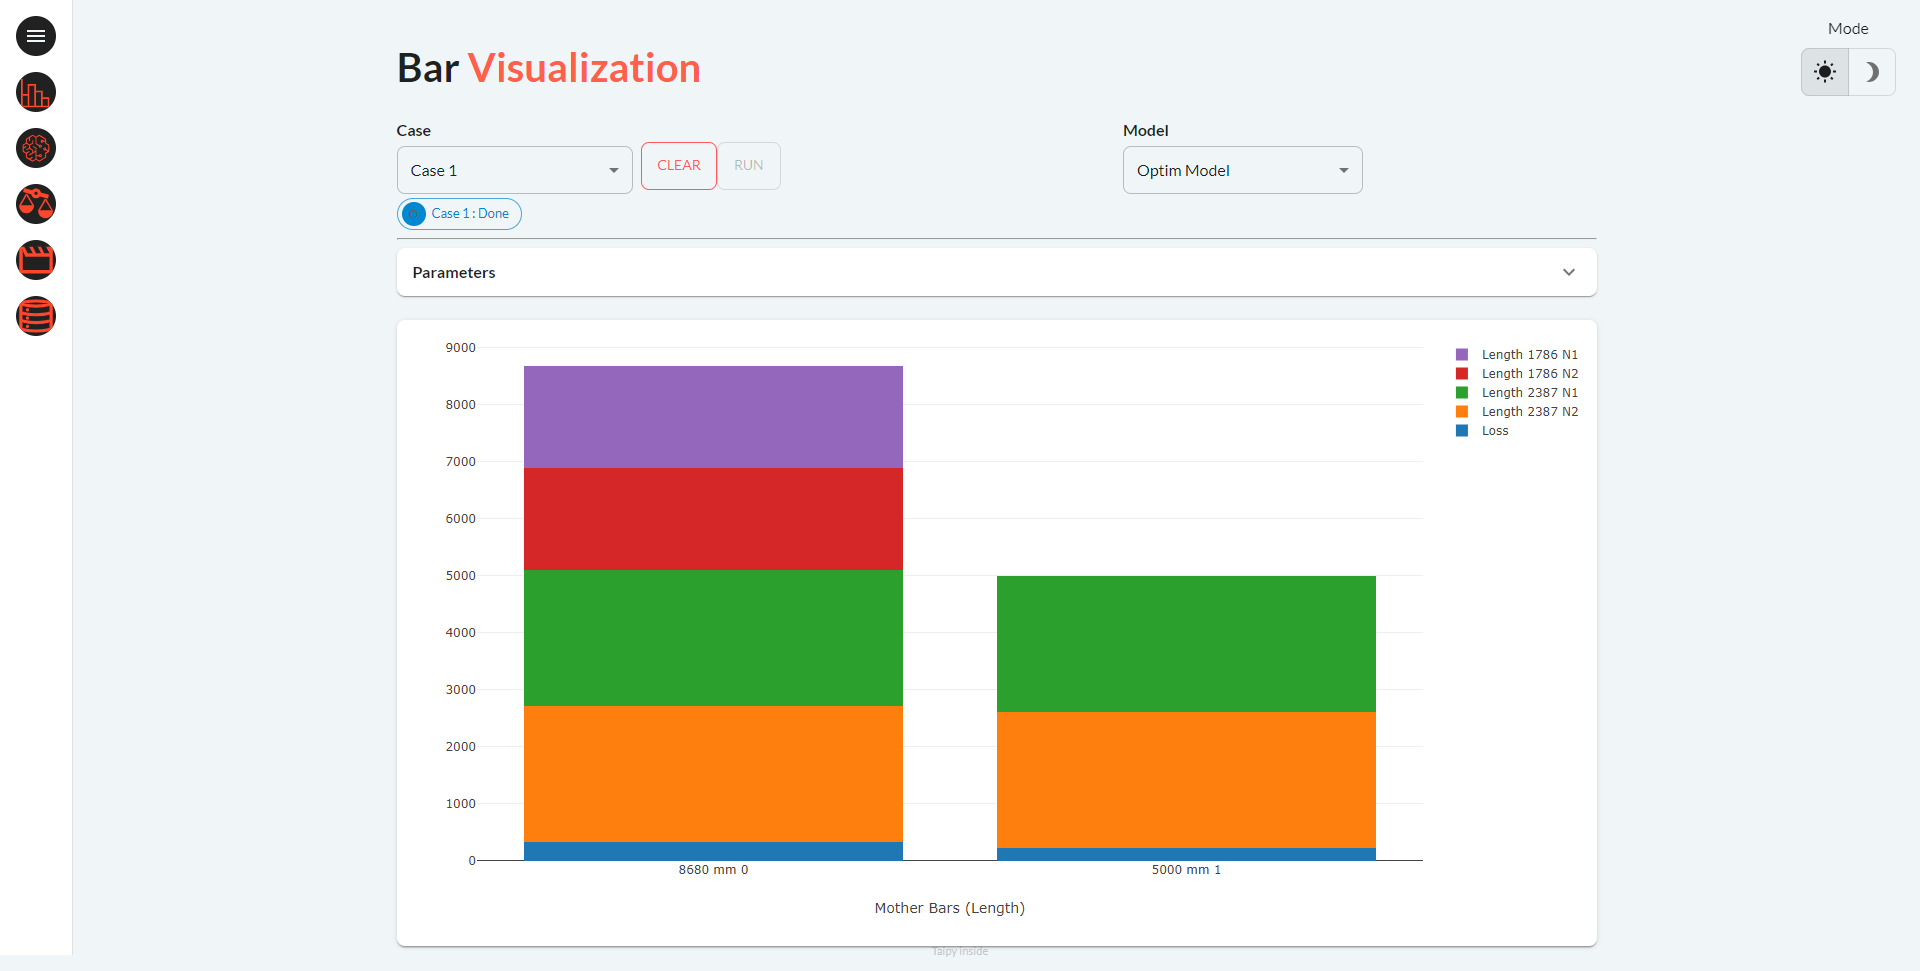
To access additional information, you can open the Parameters panel (Taipy Expandable) to review the input data related to the selected case, Stock available and Demand to fulfill.
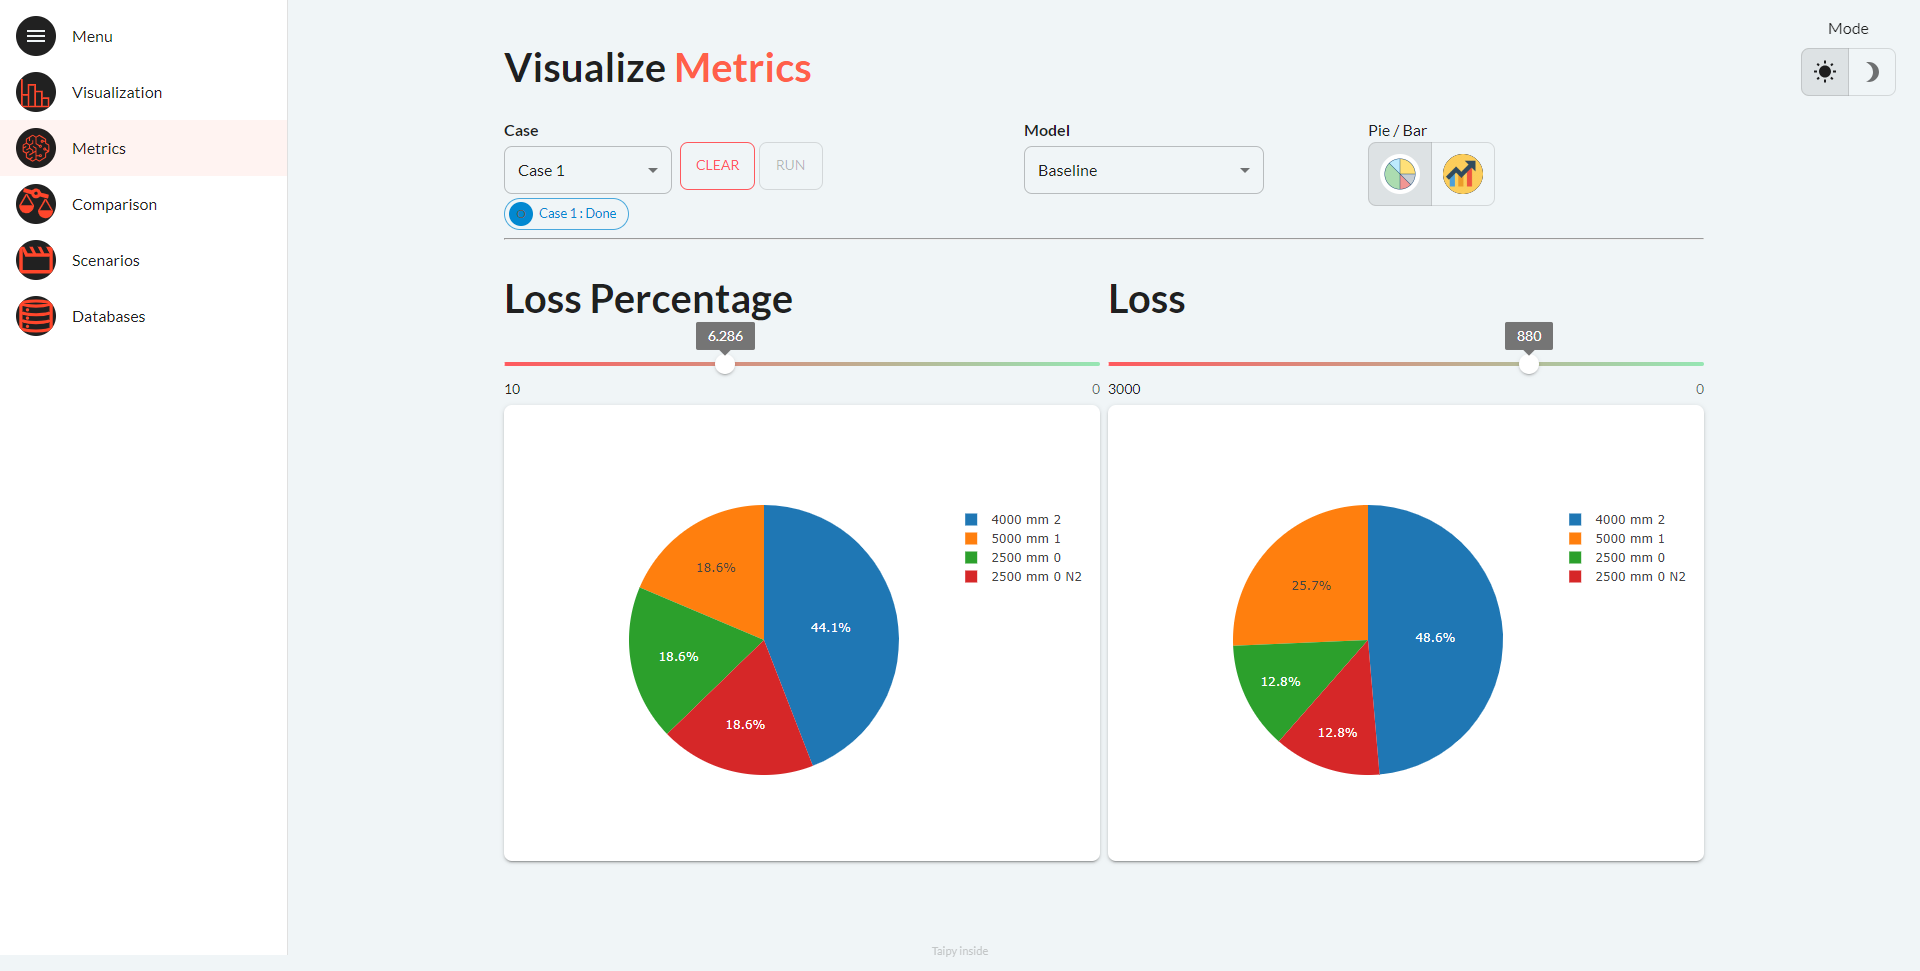
Page 2: Visual Metrics
On this page, you'll find metrics for both the Baseline Model and the Optim Model presented in two distinct formats: bar charts and pie charts. These metrics provide insights into the loss, which can be visualized as either a percentage of the total length of the mother bars utilized or as the precise loss value measured in millimeters.
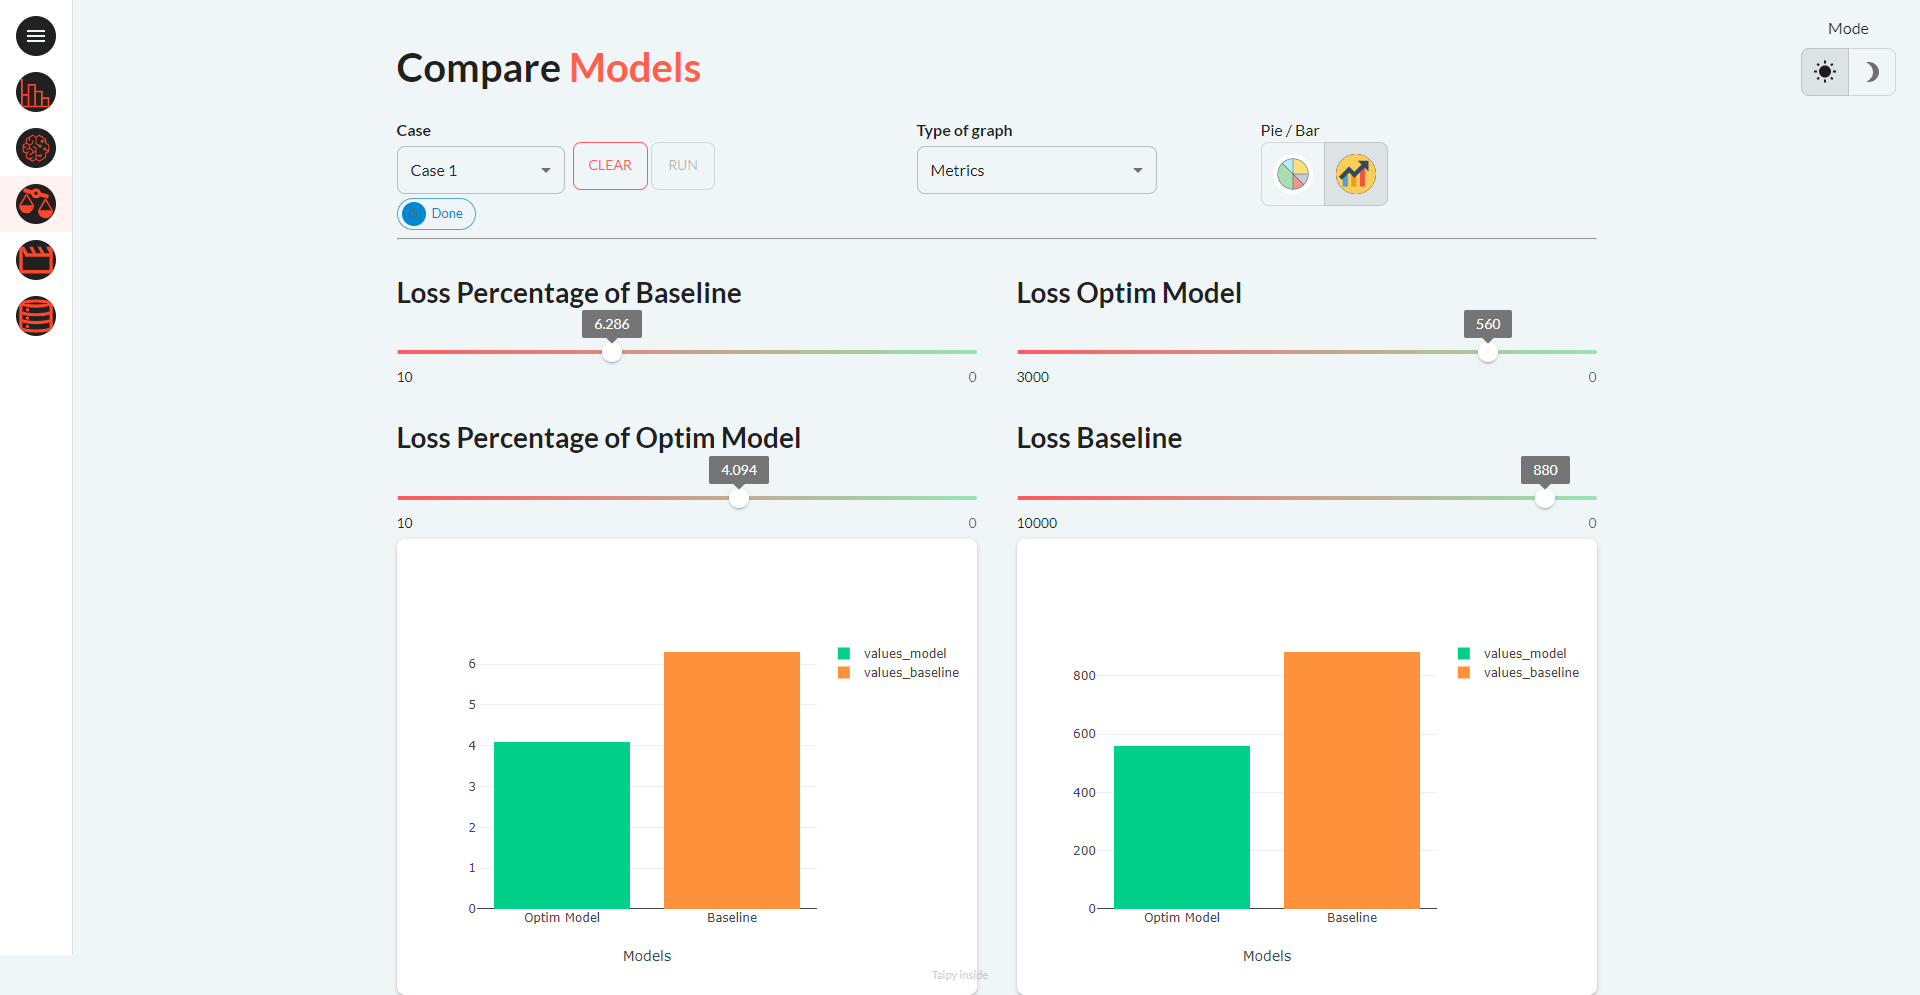
Page 3: Compare Models
Compare Baseline and Optim models' performance side by side.
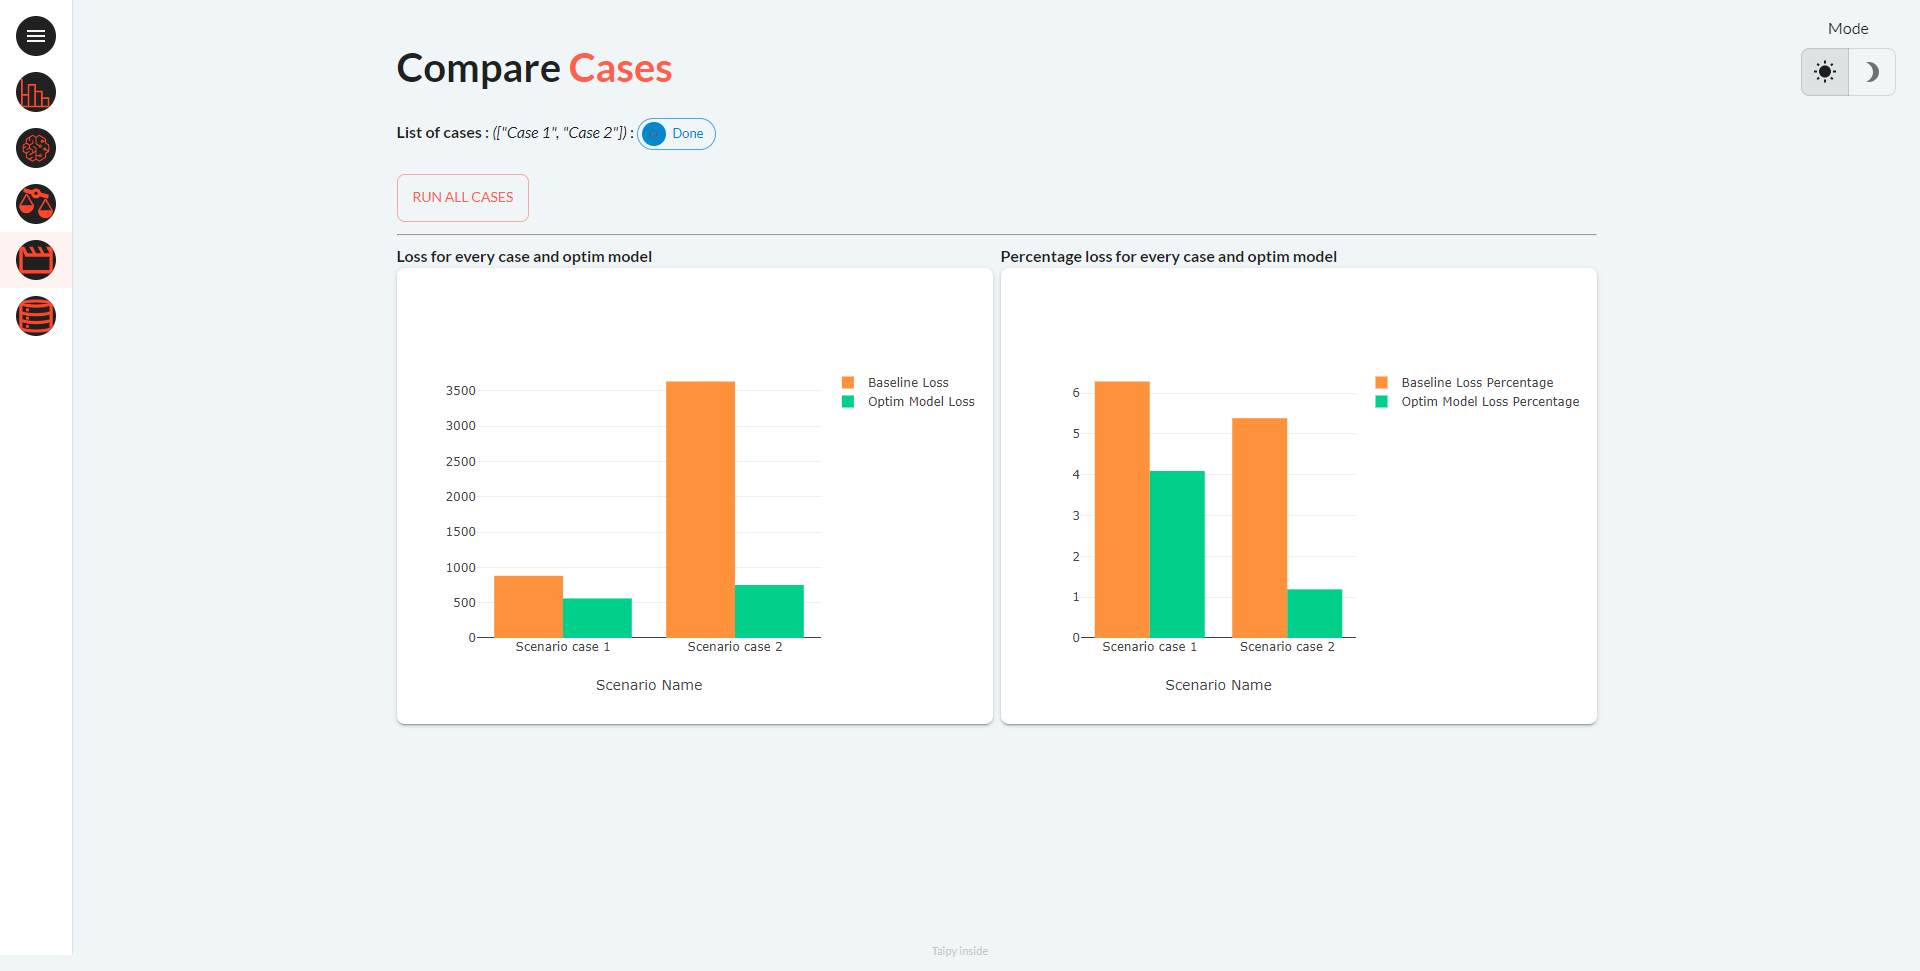
Page 4: Compare Cases
Assess the performance of each model across various scenarios. This represents one of Taipy's most valuable features.
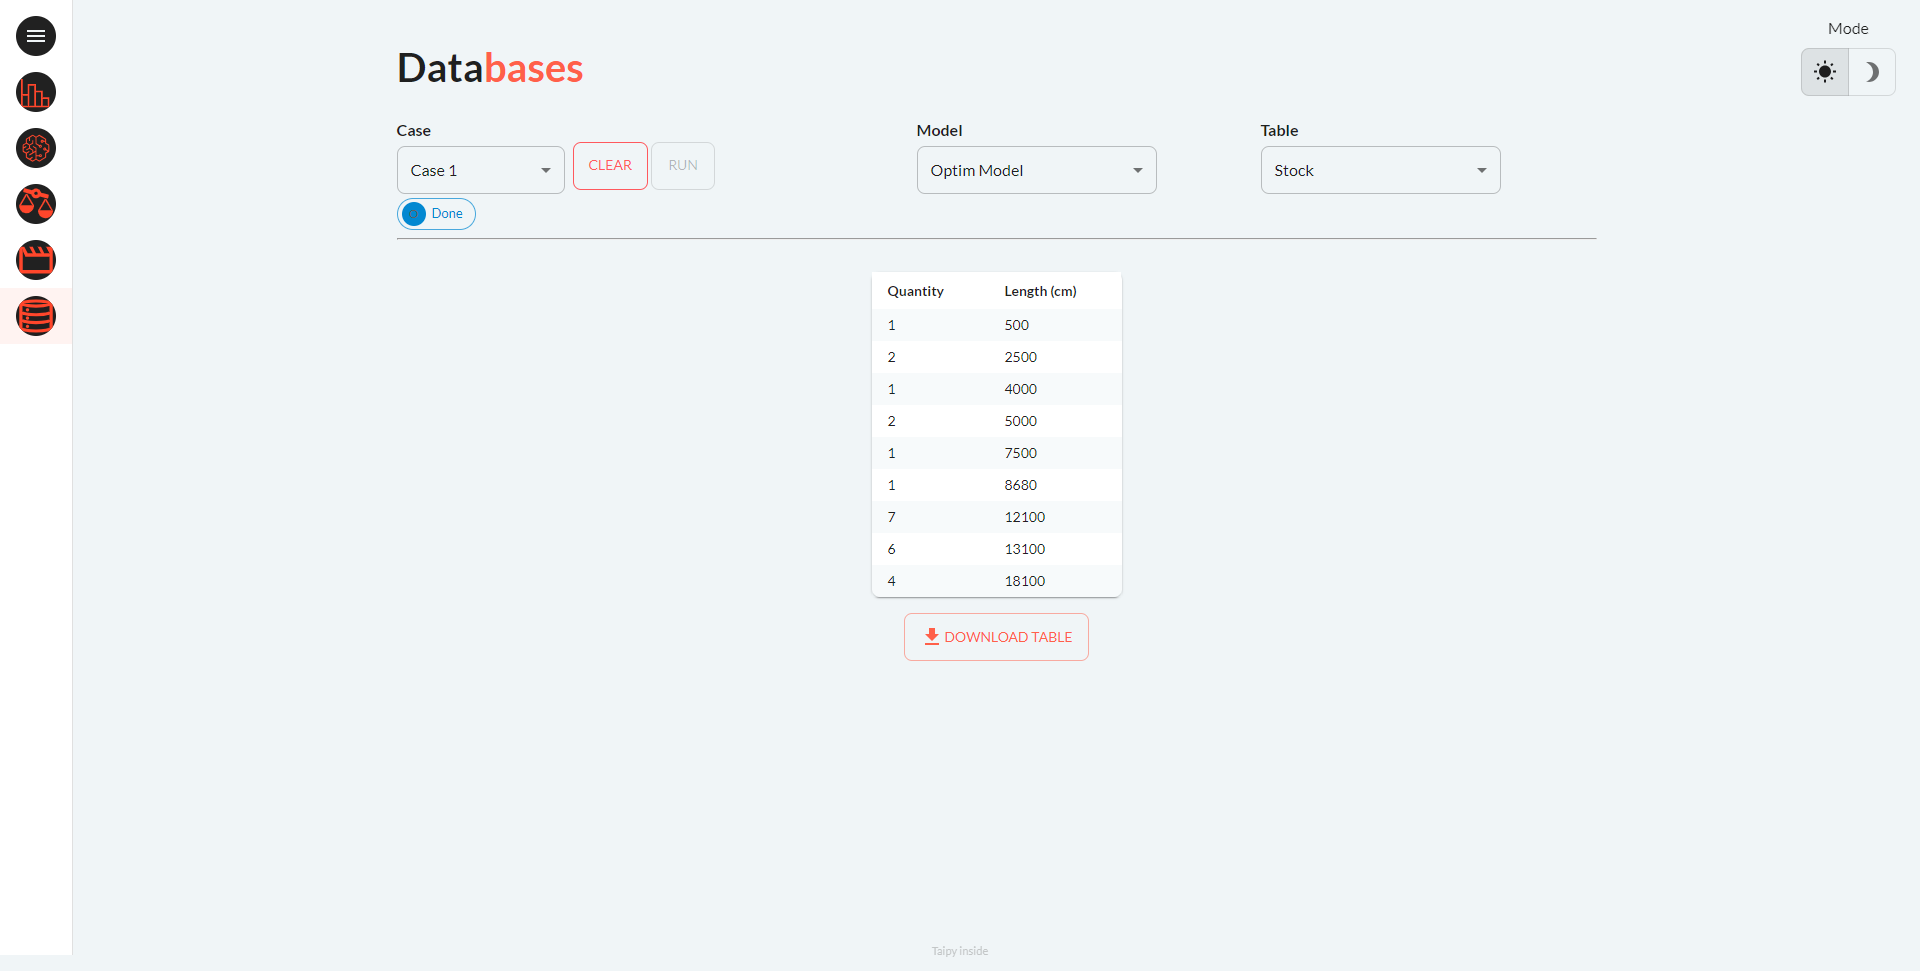
Page 5: Databases
Results are neatly summarized in a table, allowing you to select the case, model and table. The results are then accessible for download in CSV format.
Disclaimer
Code for this demo is not publicly available yet. Contact us for a sample.