Visualization
Delve into applications that focus on visualization.
-

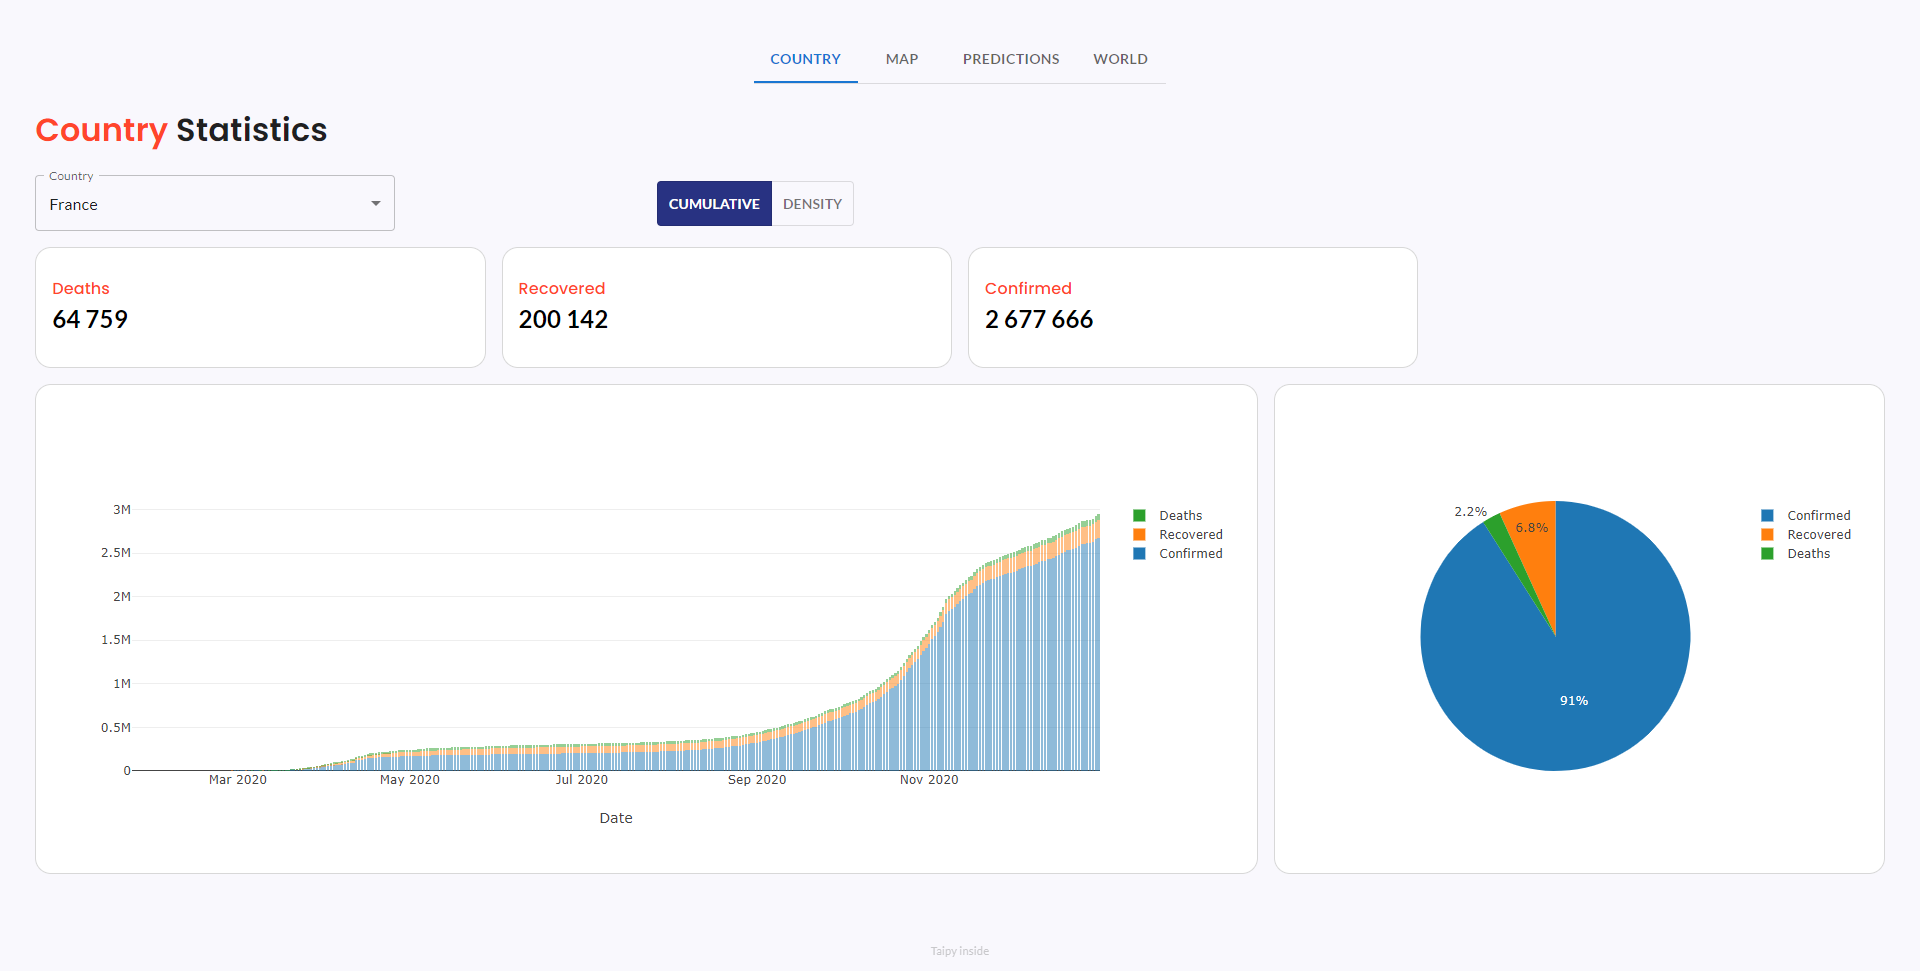
Covid Dashboard
Forecast COVID-19 data for various countries, interact with maps, and gain insights into the pandemic impact.
-

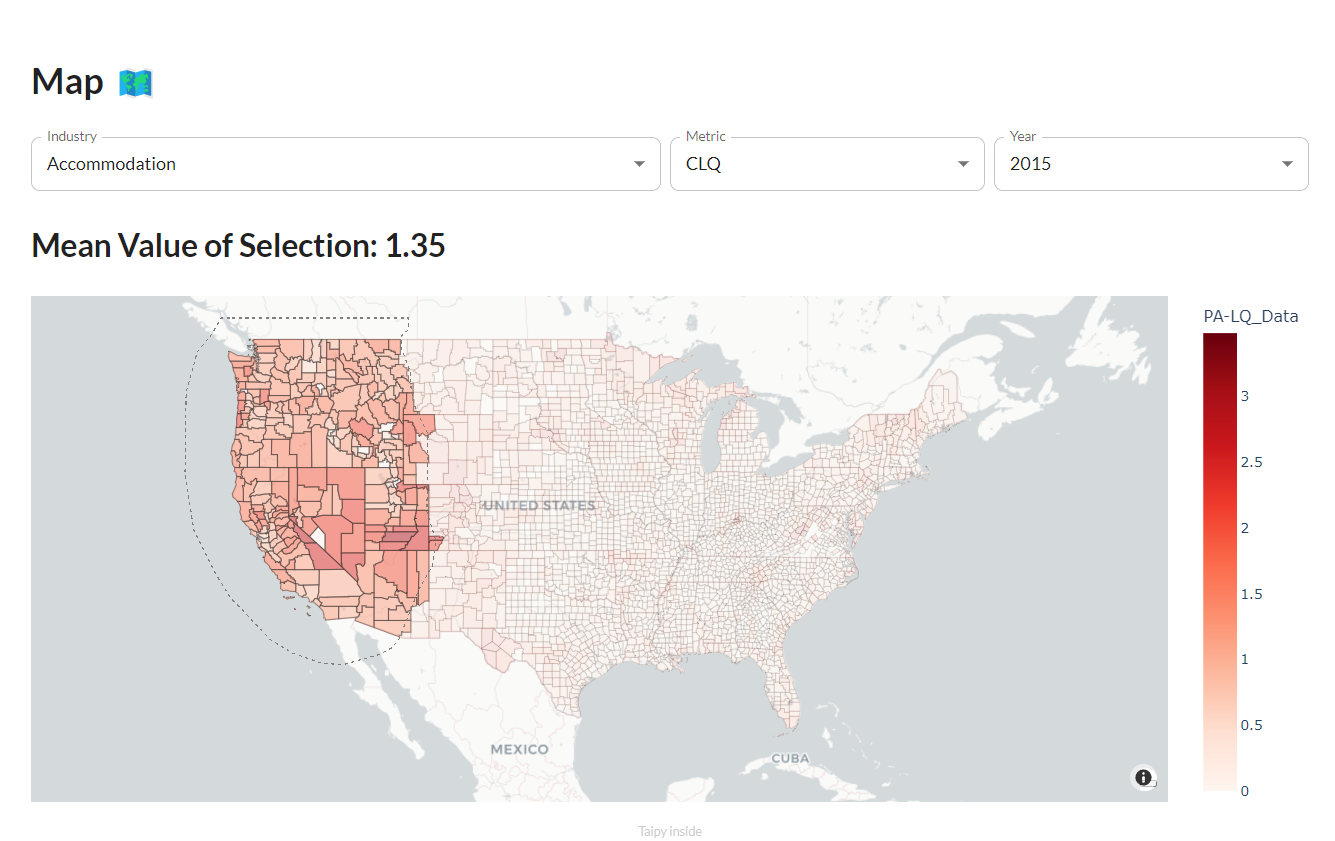
Measuring Industry Agglomeration
Explore where industries are concentrated and how they are distributed across the United States.
-
Image Classification
Explore our interactive image classification application built with Taipy, Nvidia CUDA, and TensorFlow.
-

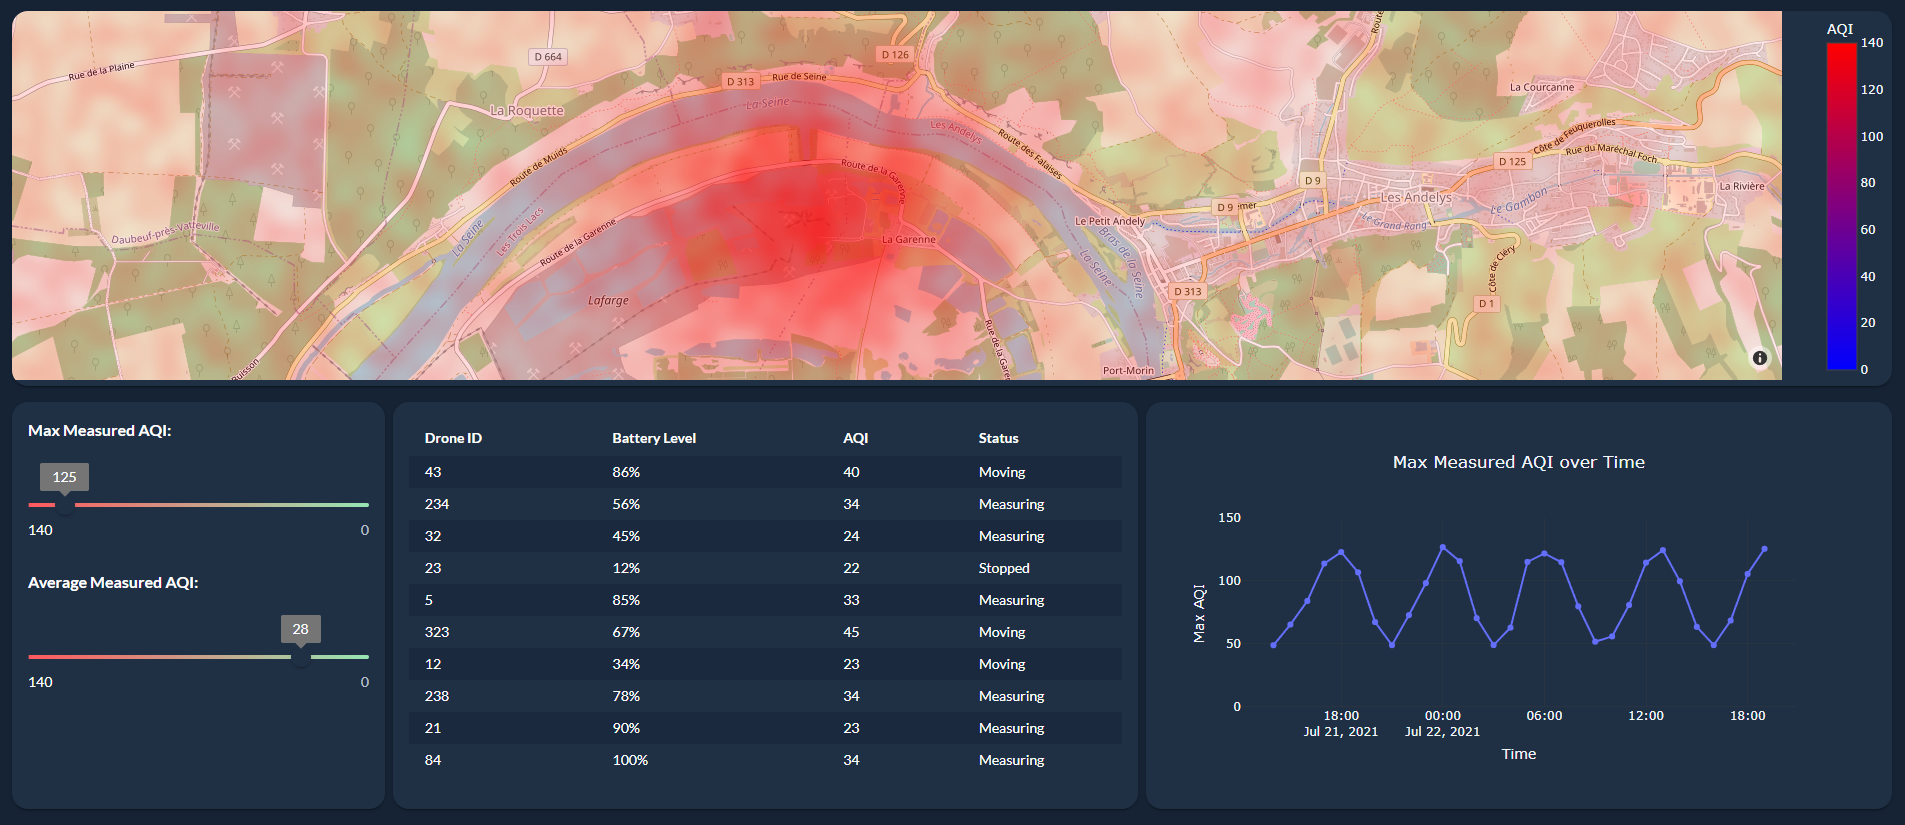
Realtime Pollution Dashboard
Streams real-time pollution data from sensors and shows air quality on a map.